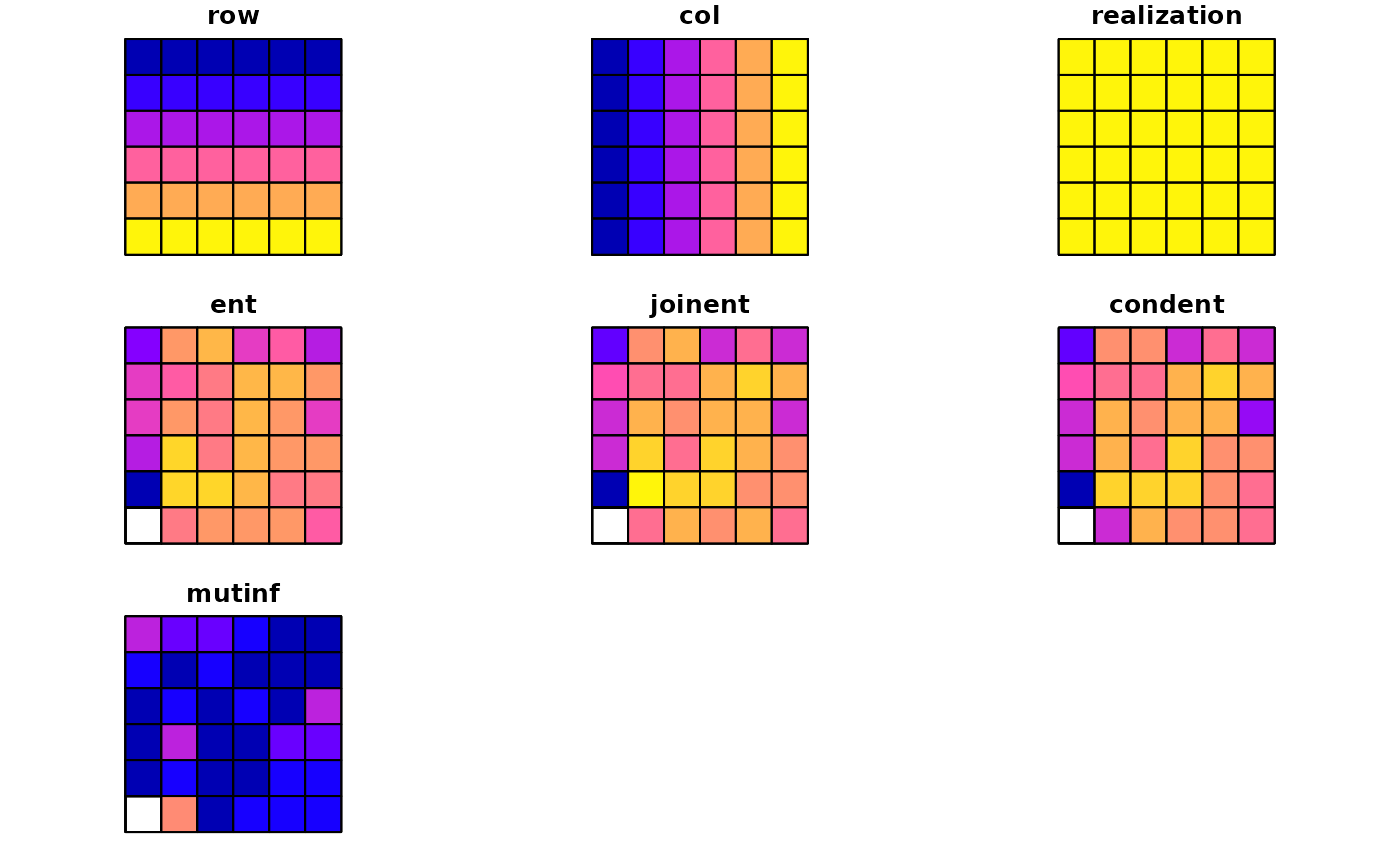
Calculates exposure matrix and quantifies it by calculating four IT-derived metrics: entropy (ent), joint entropy (joinent), conditional entropy (condent) and mutual information (mutinf). Entropy is associated with measuring racial diversity and mutual information is associated with measuring racial segregation.
calculate_metrics(
  x,
  w,
  neighbourhood = 4,
  fun,
  size = NULL,
  shift = NULL,
  na_action = "replace",
  base = "log2",
  ordered = TRUE,
  threshold = 0.5
)
Arguments
- x
SpatRaster with realizations
- w
SpatRaster with local densities
- neighbourhood
The number of directions in which cell adjacencies are considered as neighbours:
4(rook's case),8(queen's case). The default is4.- fun
Function to calculate values from adjacent cells to contribute to exposure matrix,
"mean"- calculate average values of local population densities from adjacent cells,"geometric_mean"- calculate geometric mean values of local population densities from adjacent cells, or"focal"assign value from the focal cell- size
Expressed in the numbers of cells, is a length of the side of a square-shaped block of cells. It defines the extent of a local pattern. If
size=NULLcalculations are performed for a whole area- shift
Defines the shift between adjacent squares of cells along with the N-S and W-E directions. It describes the density (resolution) of the output grid. The resolution of the output map will be reduced to the original resolution multiplied by the shift. If shift=size the input map will be divided into a grid of non-overlapping square windows. Each square window defines the extent of a local pattern. If shift < size - results in the grid of overlapping square windows.
- na_action
Decides on how to behave in the presence of missing values in
w. Possible options are"replace","omit","keep". The default,"replace", replaces missing values with 0,"omit"does not use cells with missing values, and"keep"keeps missing values.- base
The unit in which entropy is measured. The default is "log2", which compute entropy in "bits".
"log"and"log10"can be also used- ordered
The type of pairs considered. Either ordered (
TRUE) or unordered (FALSE). The default isTRUE- threshold
The share of NA cells to allow metrics calculation in a square-shaped window
Value
a data.frame
Examples
library(terra)
race_raster = rast(system.file("extdata/race_raster.tif", package = "raceland"))
x = create_realizations(race_raster, n = 5)
w = create_densities(x, race_raster, window_size = 10)

#1
df = calculate_metrics(x, w, neighbourhood = 4, fun = "mean")

#2
df2 = calculate_metrics(x, w, neighbourhood = 4, fun = "mean", size = 10, threshold = 0.5)
my_grid = create_grid(x, size = 10)

df3 = dplyr::filter(df2, realization == 2)
result = dplyr::left_join(my_grid, df2, by = c("row", "col"))
plot(result)