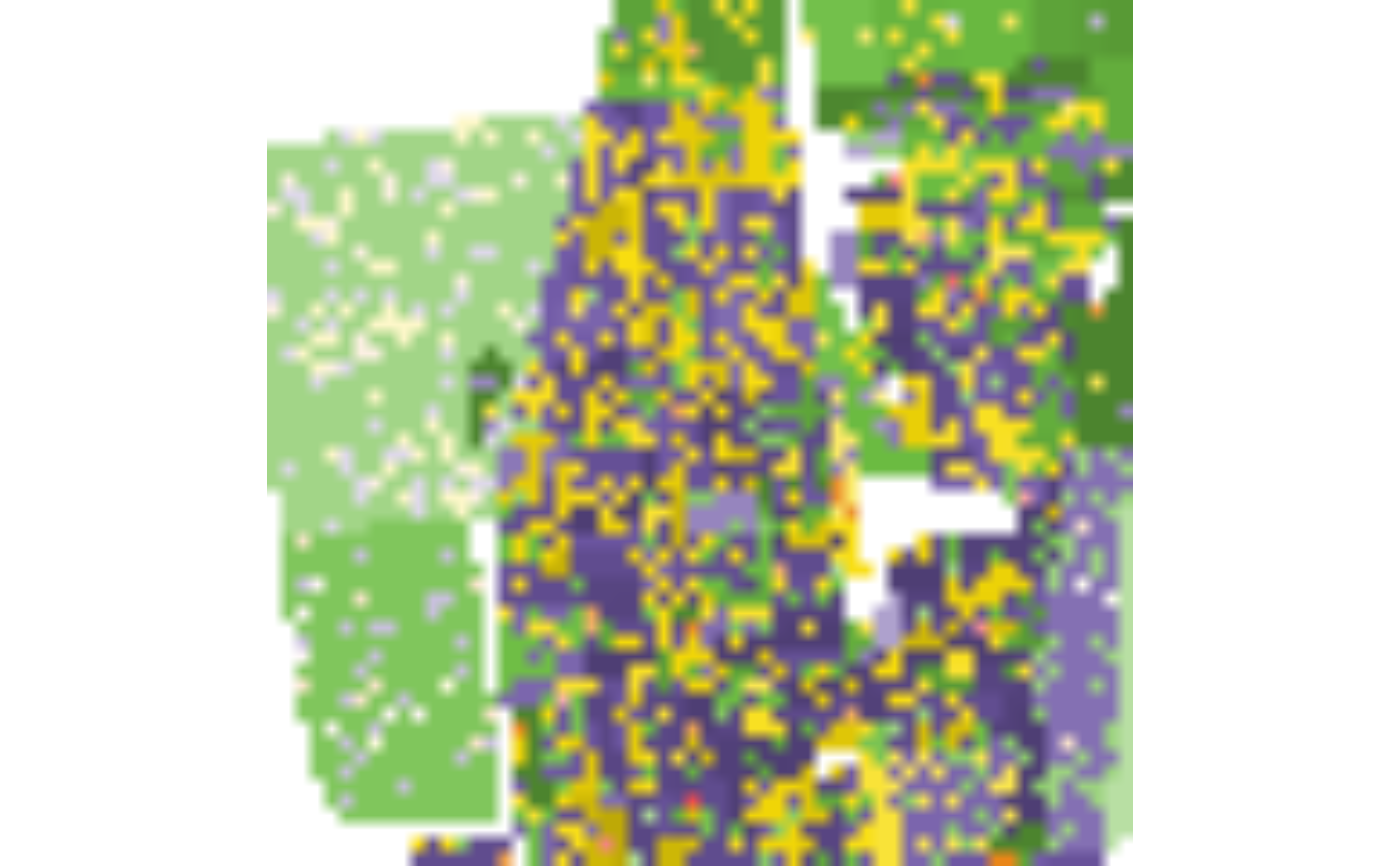
Displays realization taking into account also subpopulation density.
plot_realization(x, y, hex, ...)Arguments
- x
A SpatRaster with one layer. Each value should correspond to a layer in
y.- y
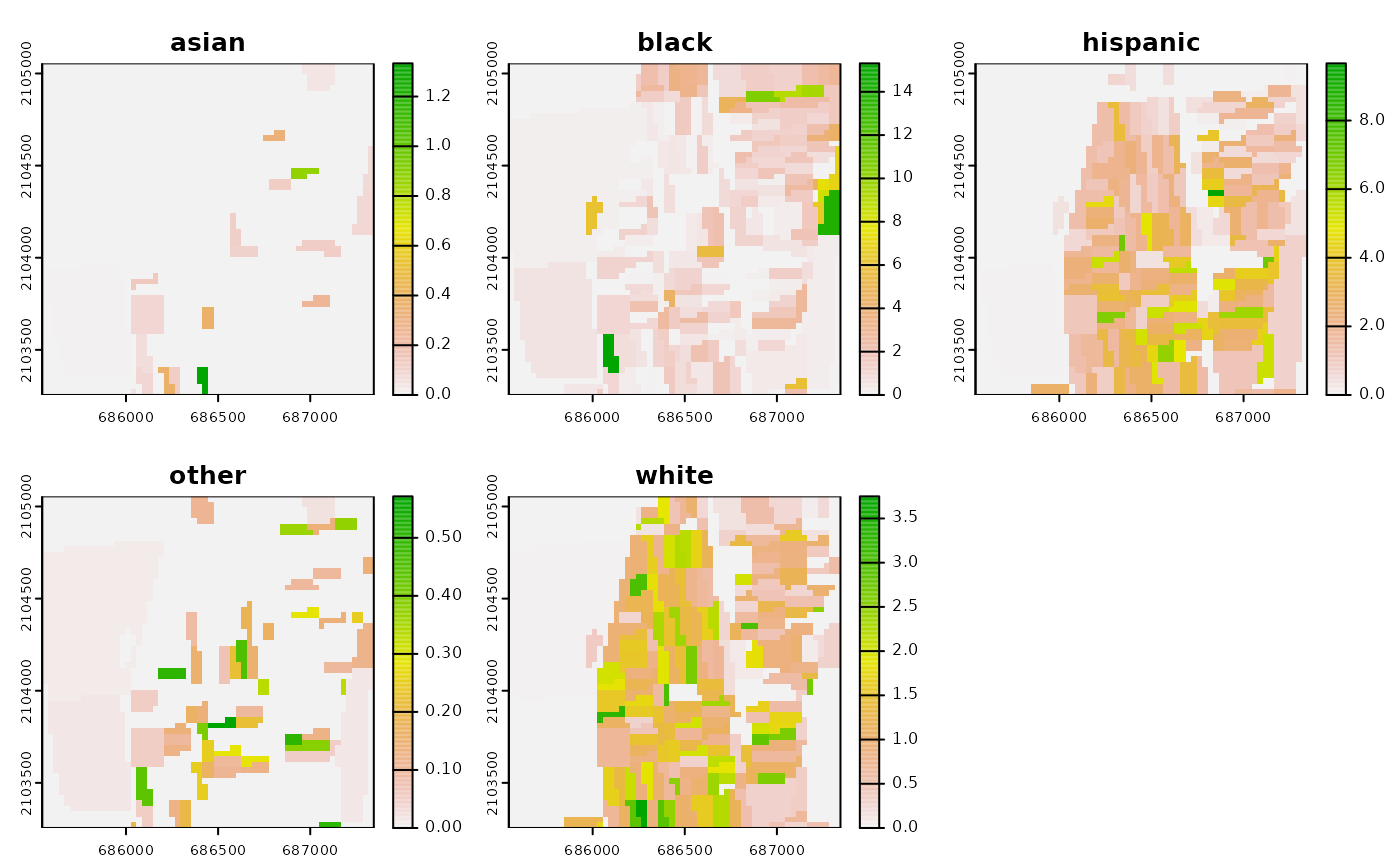
A SpatRaster with race-specific population densities
- hex
A character vector with colors specified in hexadecimal format. Each color should correspond to a layer in
yand value inx.- ...
Additional arguments as for
terra::plotRGB()
Examples
library(terra)
race_raster = rast(system.file("extdata/race_raster.tif", package = "raceland"))
hex_colors = c("#F16667", "#6EBE44", "#7E69AF", "#C77213","#F8DF1D")
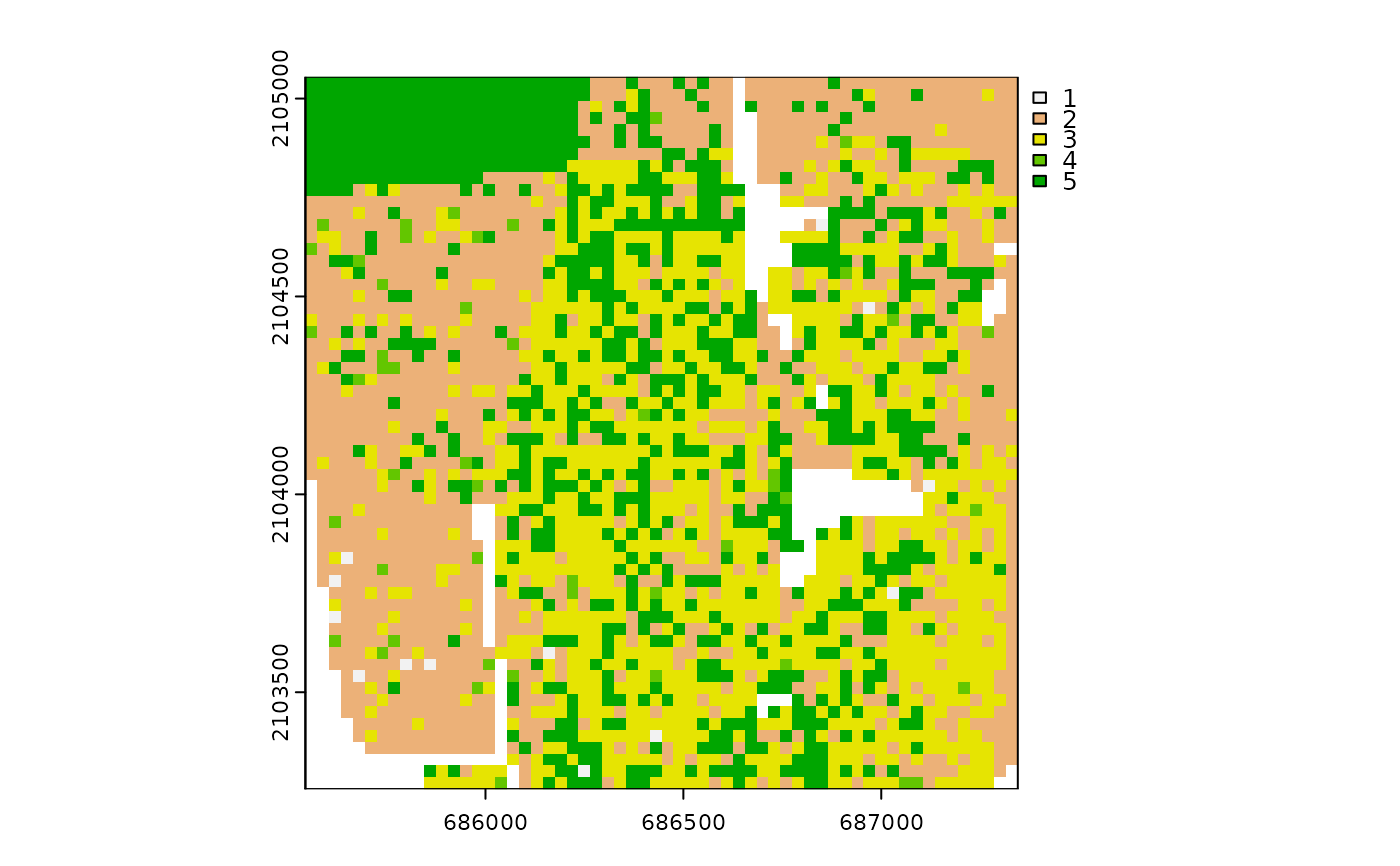
realization = create_realizations(race_raster, 1)
plot(race_raster)
 plot(realization)
 plot_realization(realization, race_raster, hex = hex_colors)