A world still to be mapped
Reflections on geocomputation in R
So… who is a geographer?
A geographer is a person who arrives in a new place and ask questions such:
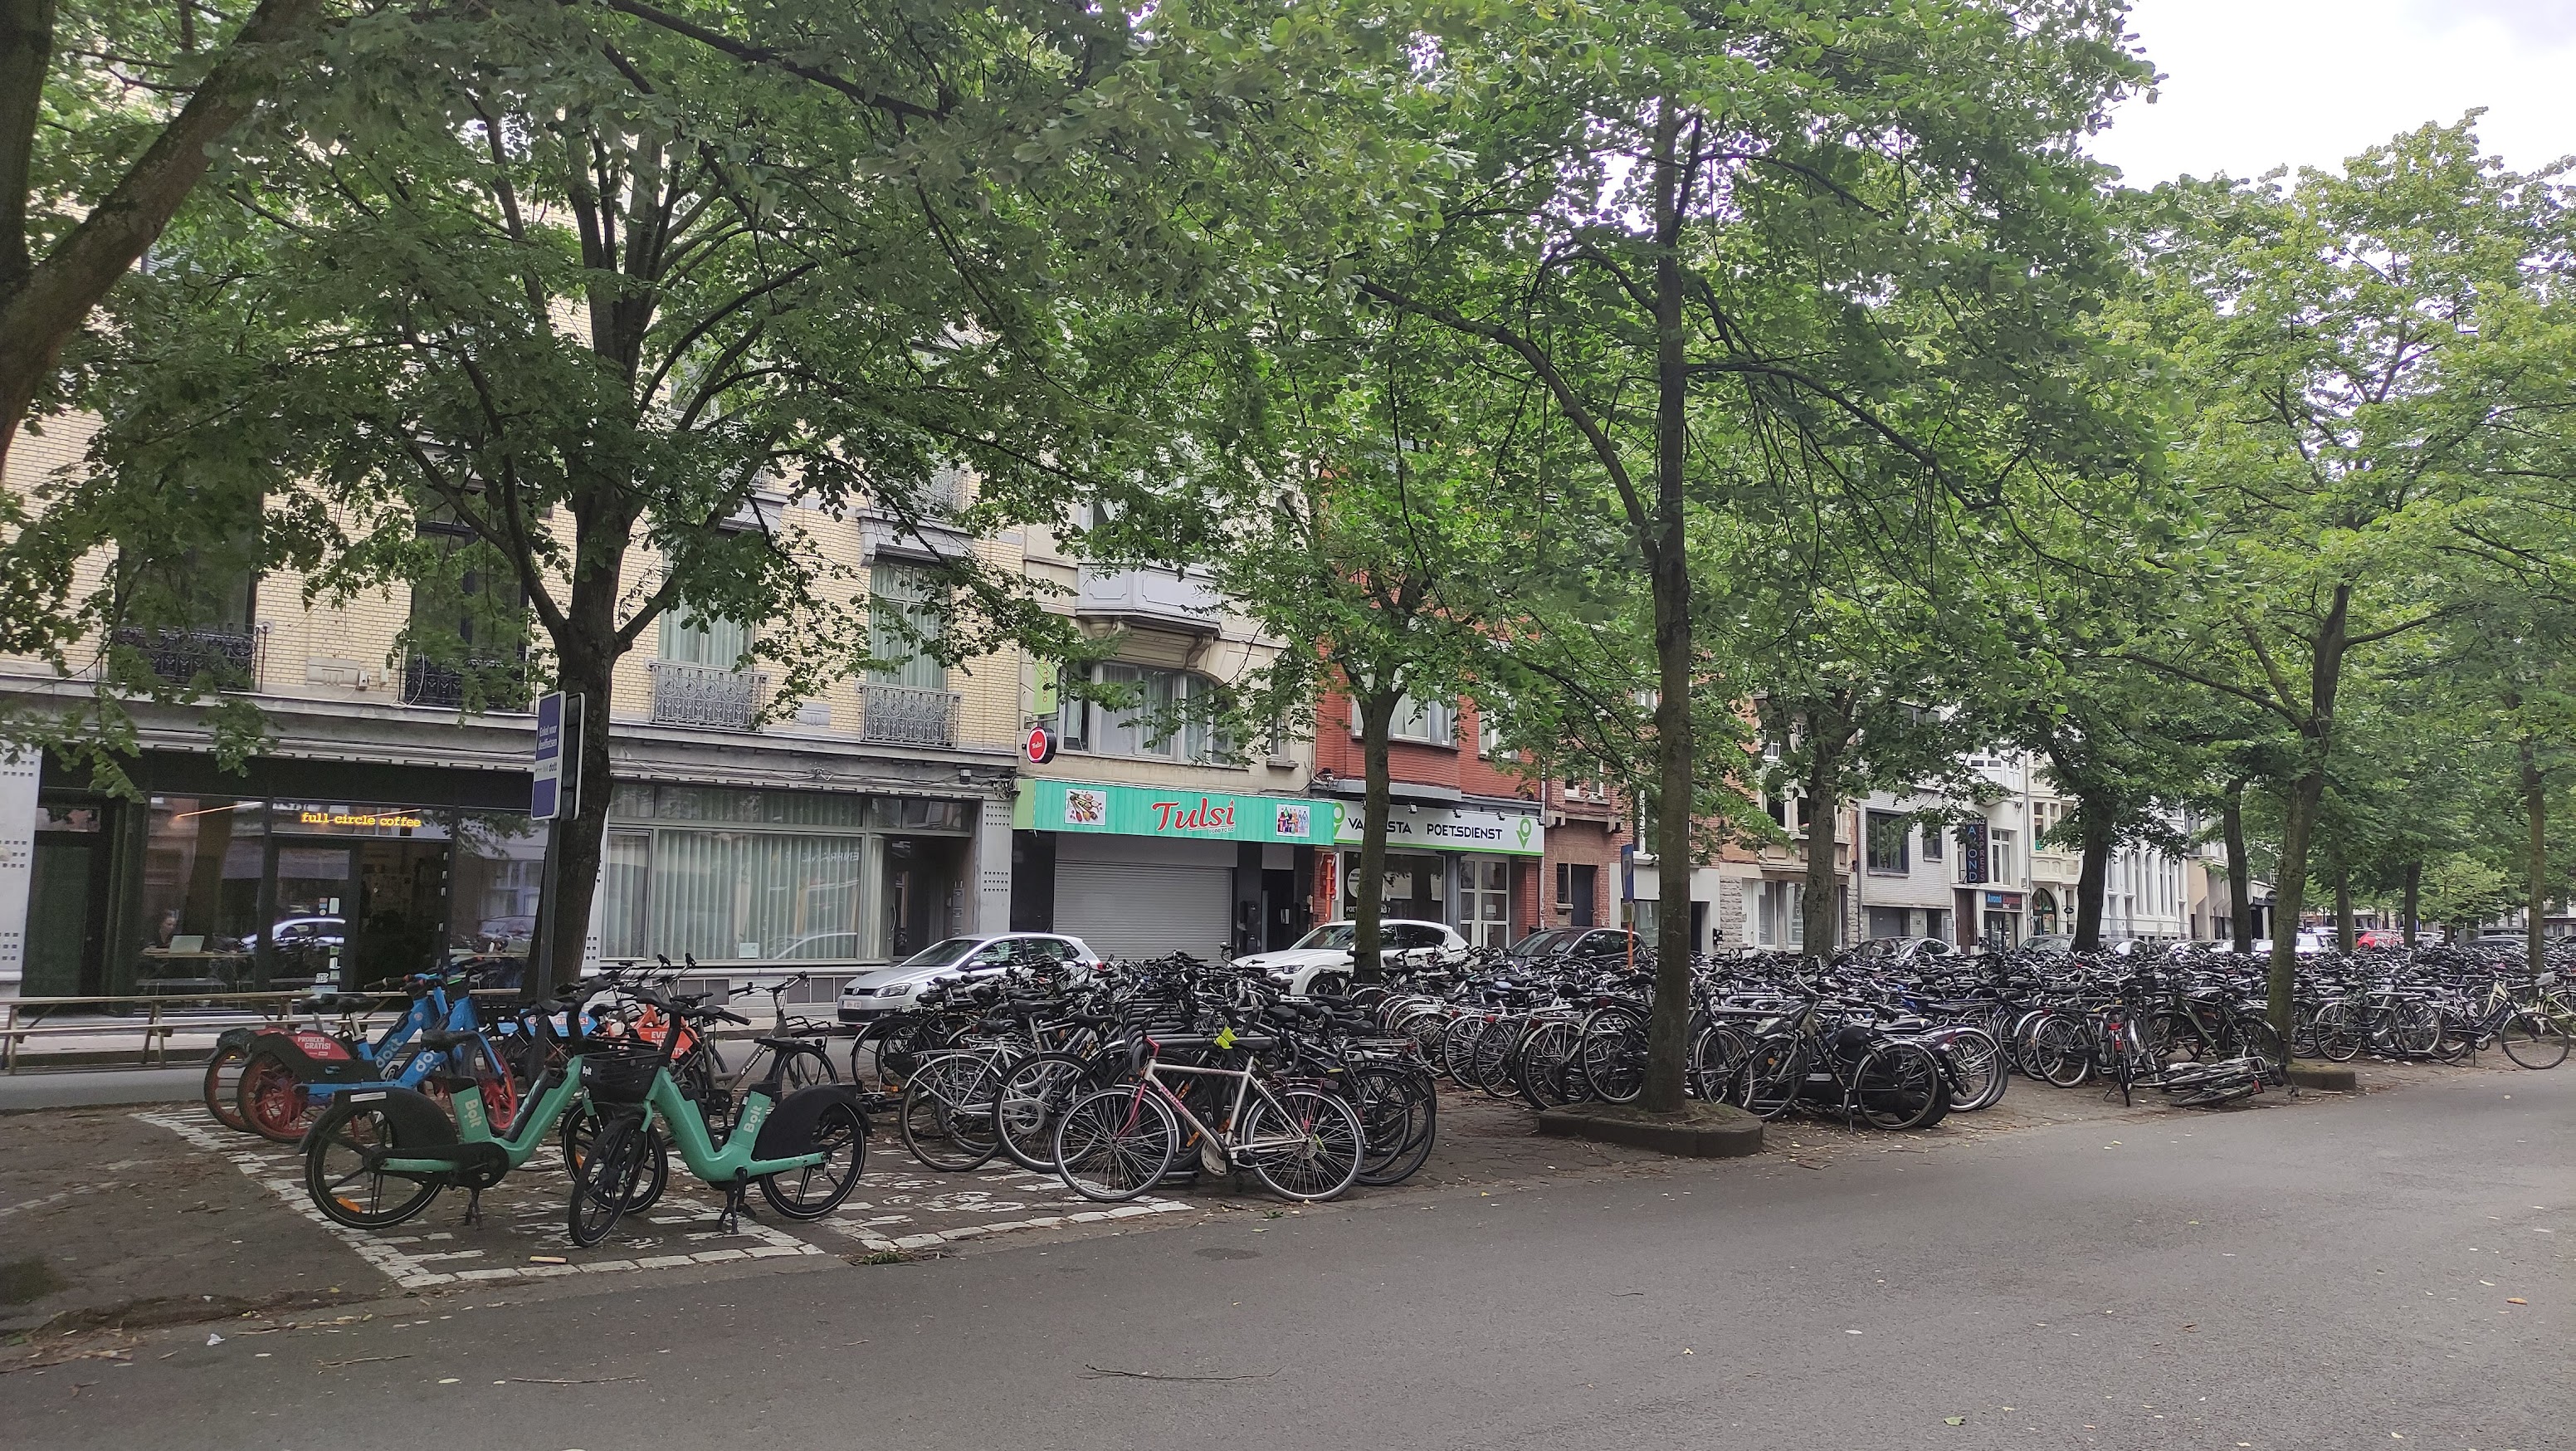
How does this city shape the way people move and interact with each other?
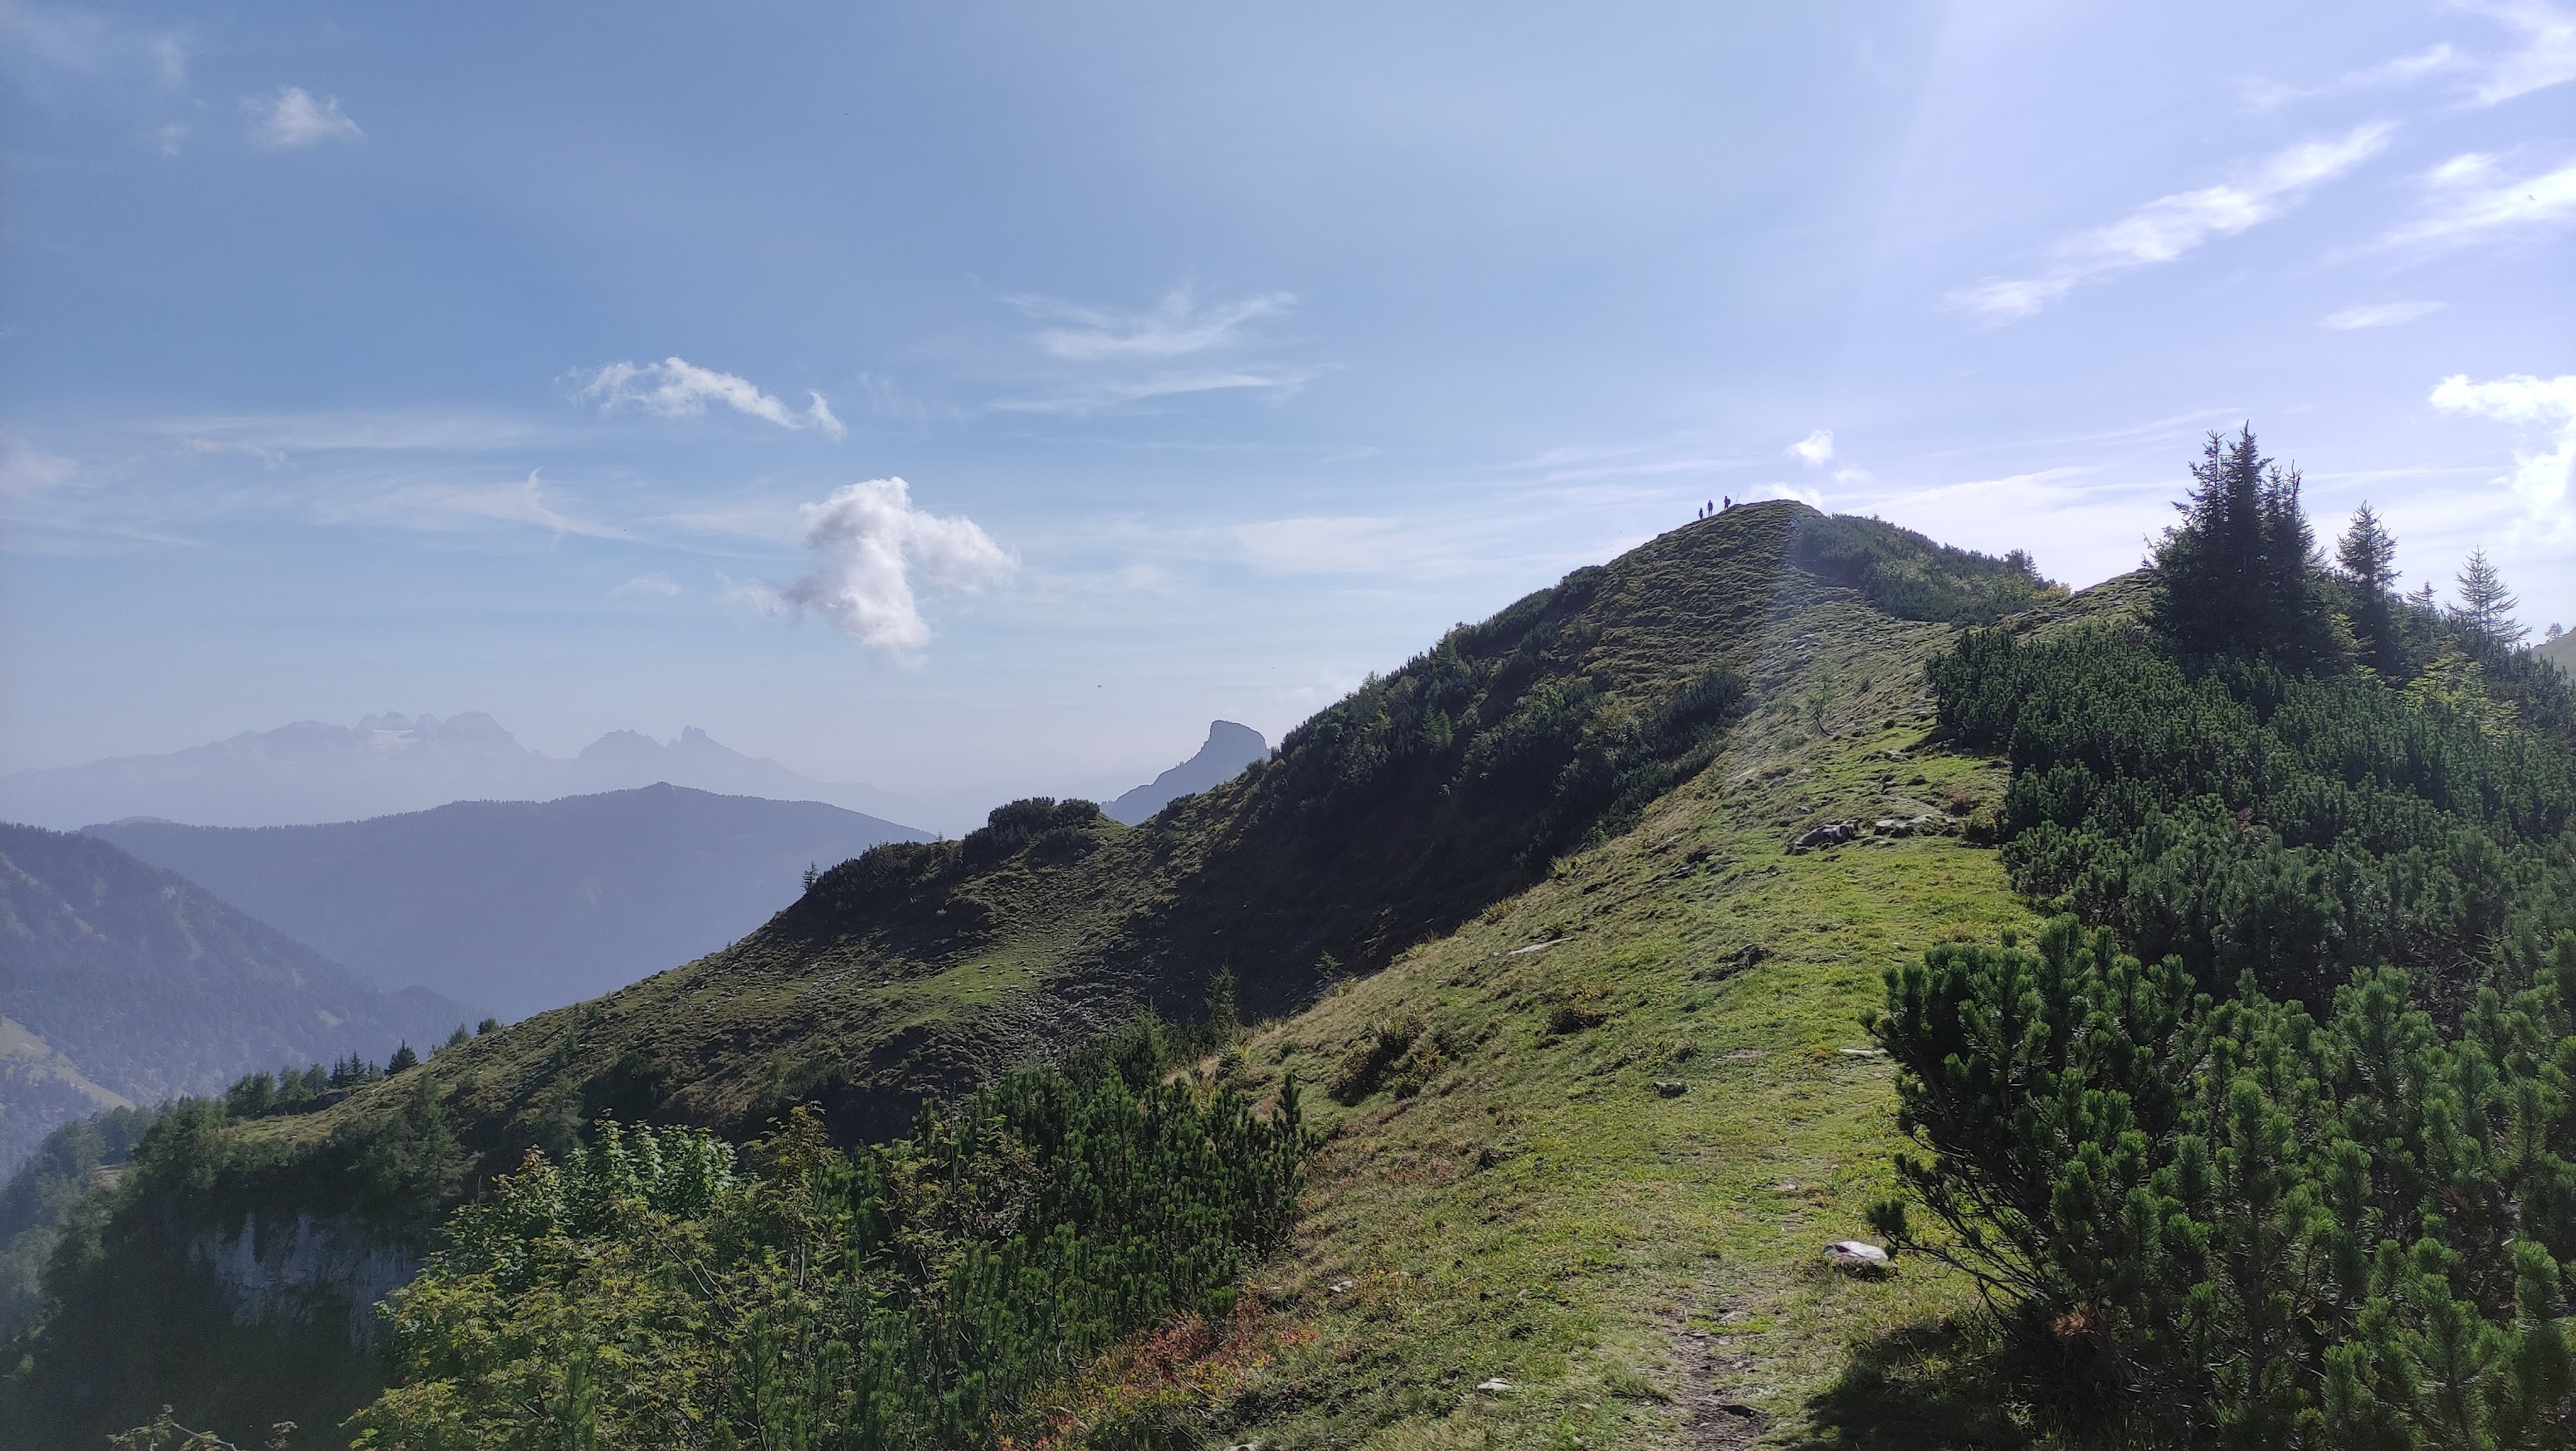
How did this landscape come to look like this?
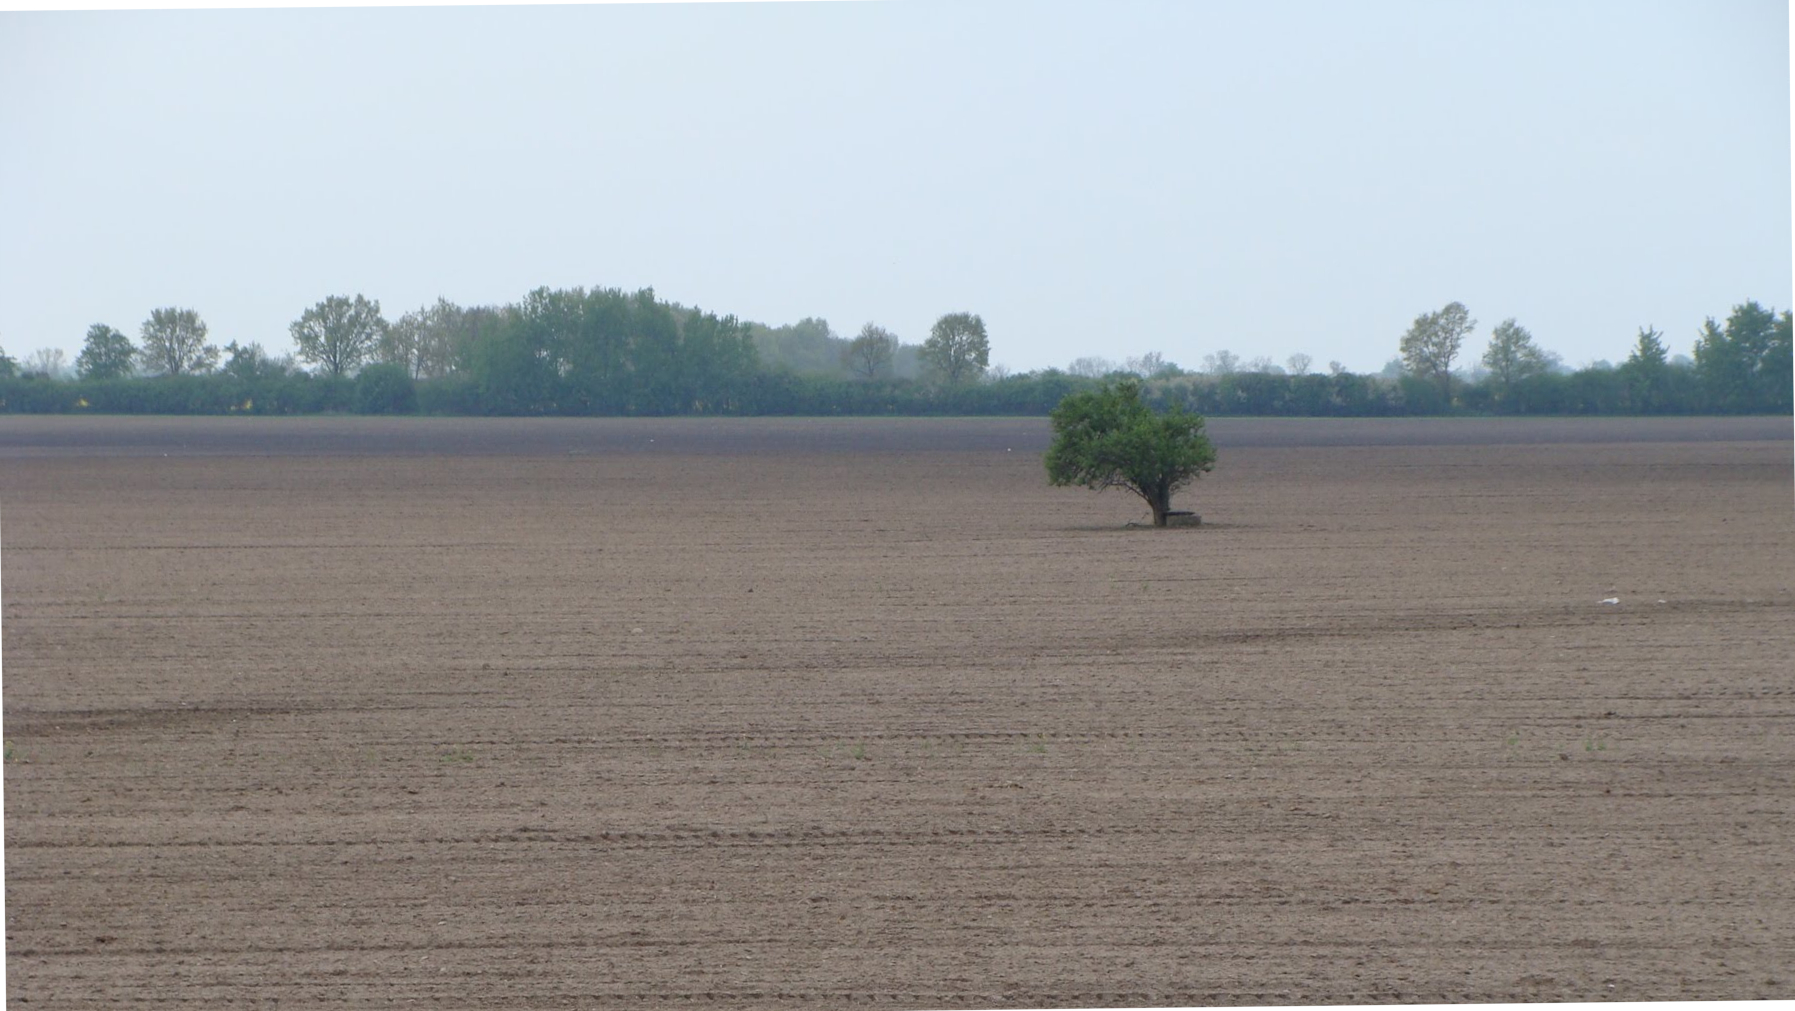
What are the properties of this soil and how do they affect agriculture and ecosystems?
Where do spatial data come from?
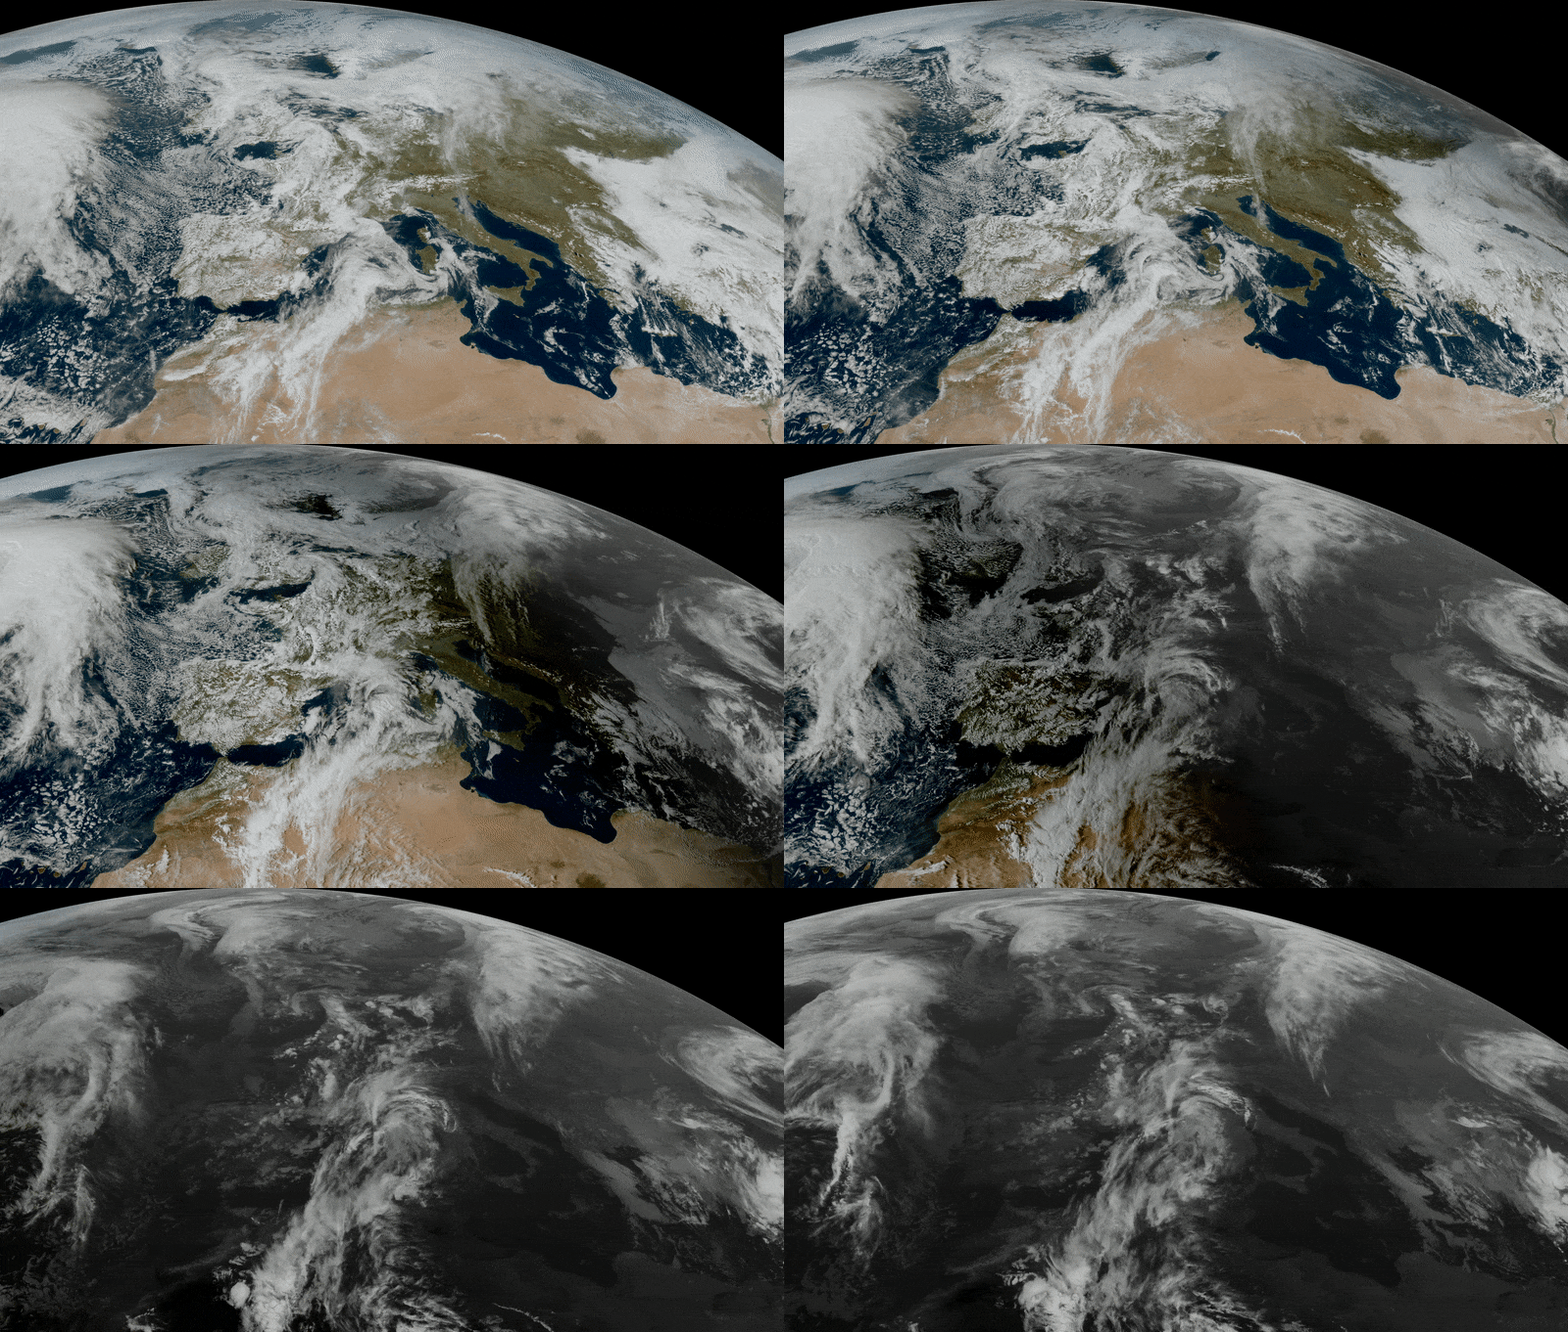
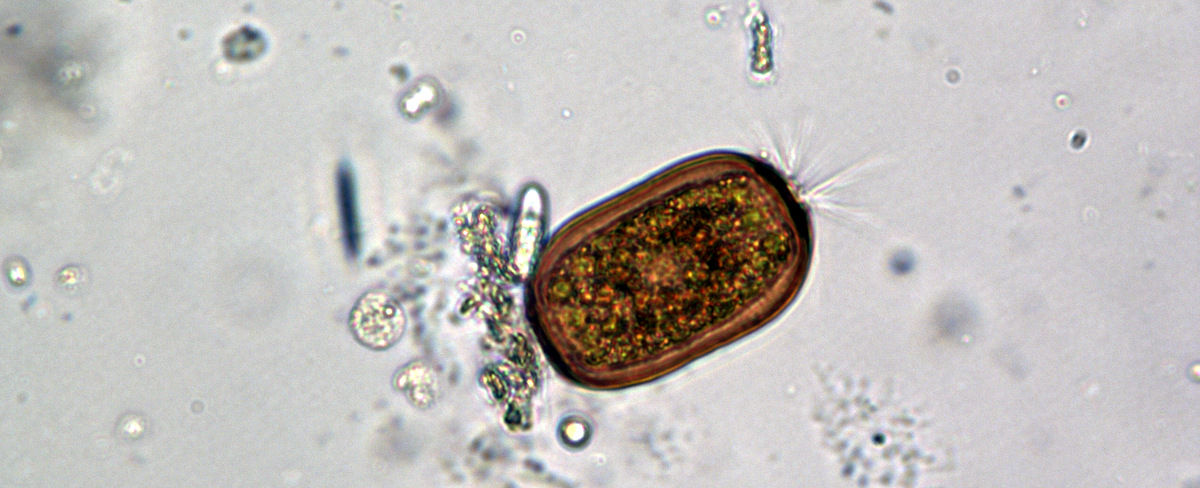
A very wide range of data sources – from satellite observations to in-situ field measurements.
Other sources
- Administrative boundaries
- Statistical data
- Analog maps
- Climate reanalyses; climate scenarios
- Crowdsourcing (e.g. OpenStreetMap)
- Social media (?)
- Real-time data (e.g. from autonomous vehicles)
- …
Remote sensing seems magical
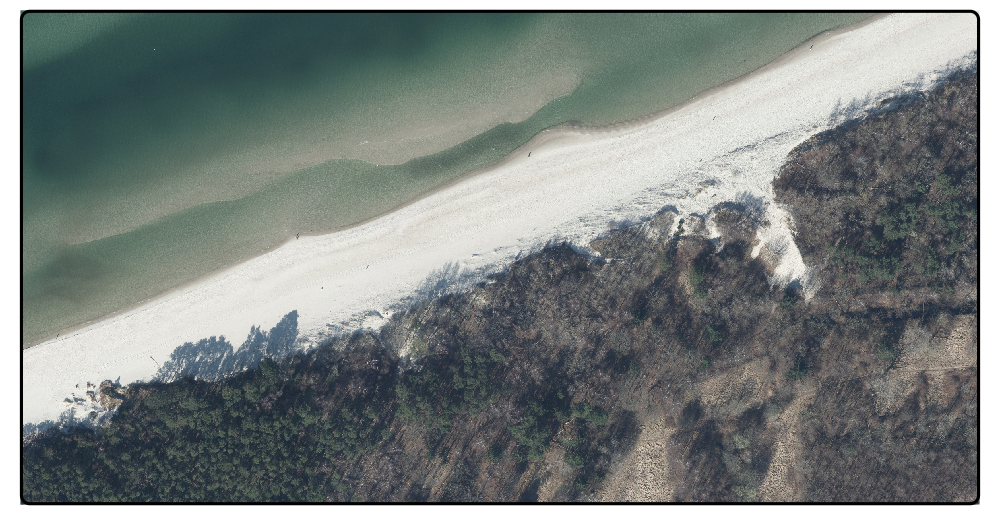
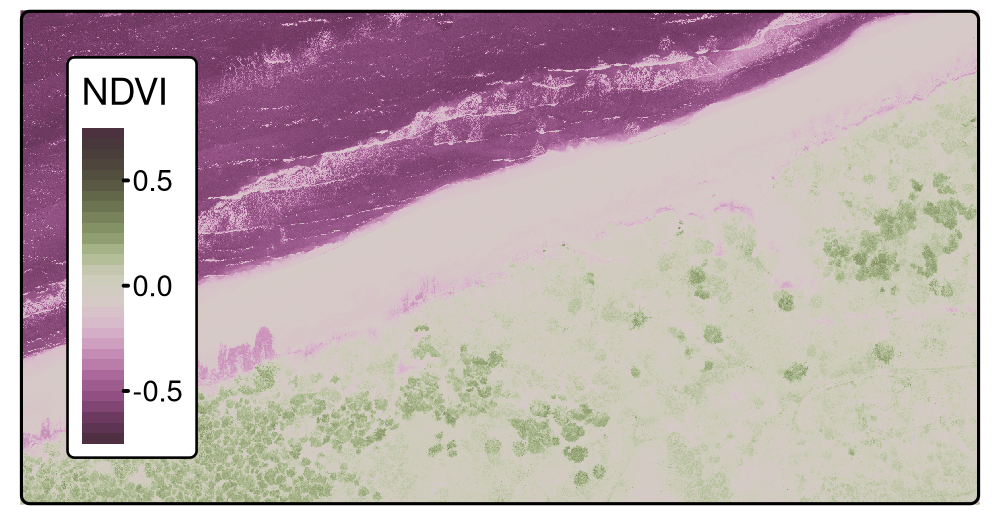
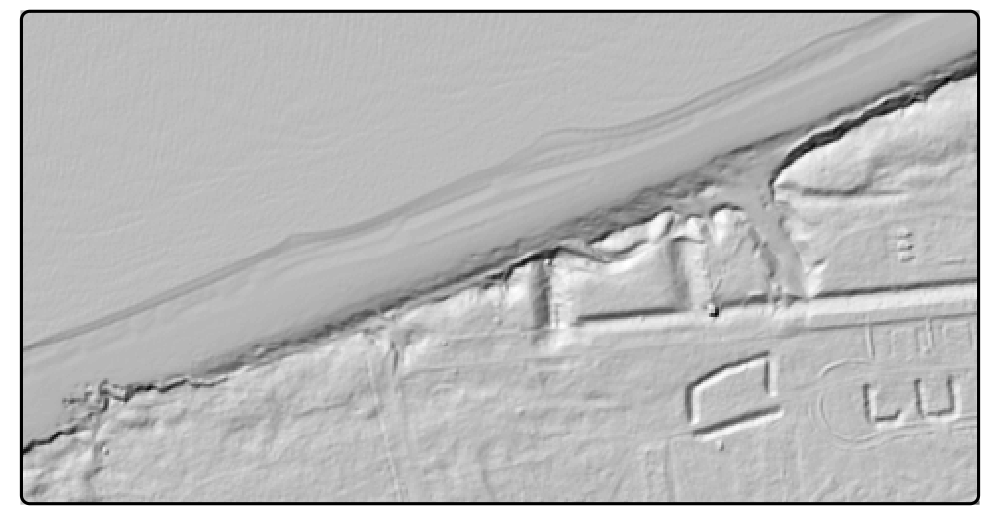
We directly observe a signal (e.g., reflected radiation), from which we infer land cover type, vegetation condition, or environmental state.
But field measurements are vital
- Traditional field measurements
- Monitoring networks
- Scientific experiments
Field data are more expensive and harder to collect, but often remain irreplaceable as direct measurements and a reference point for remote sensing data
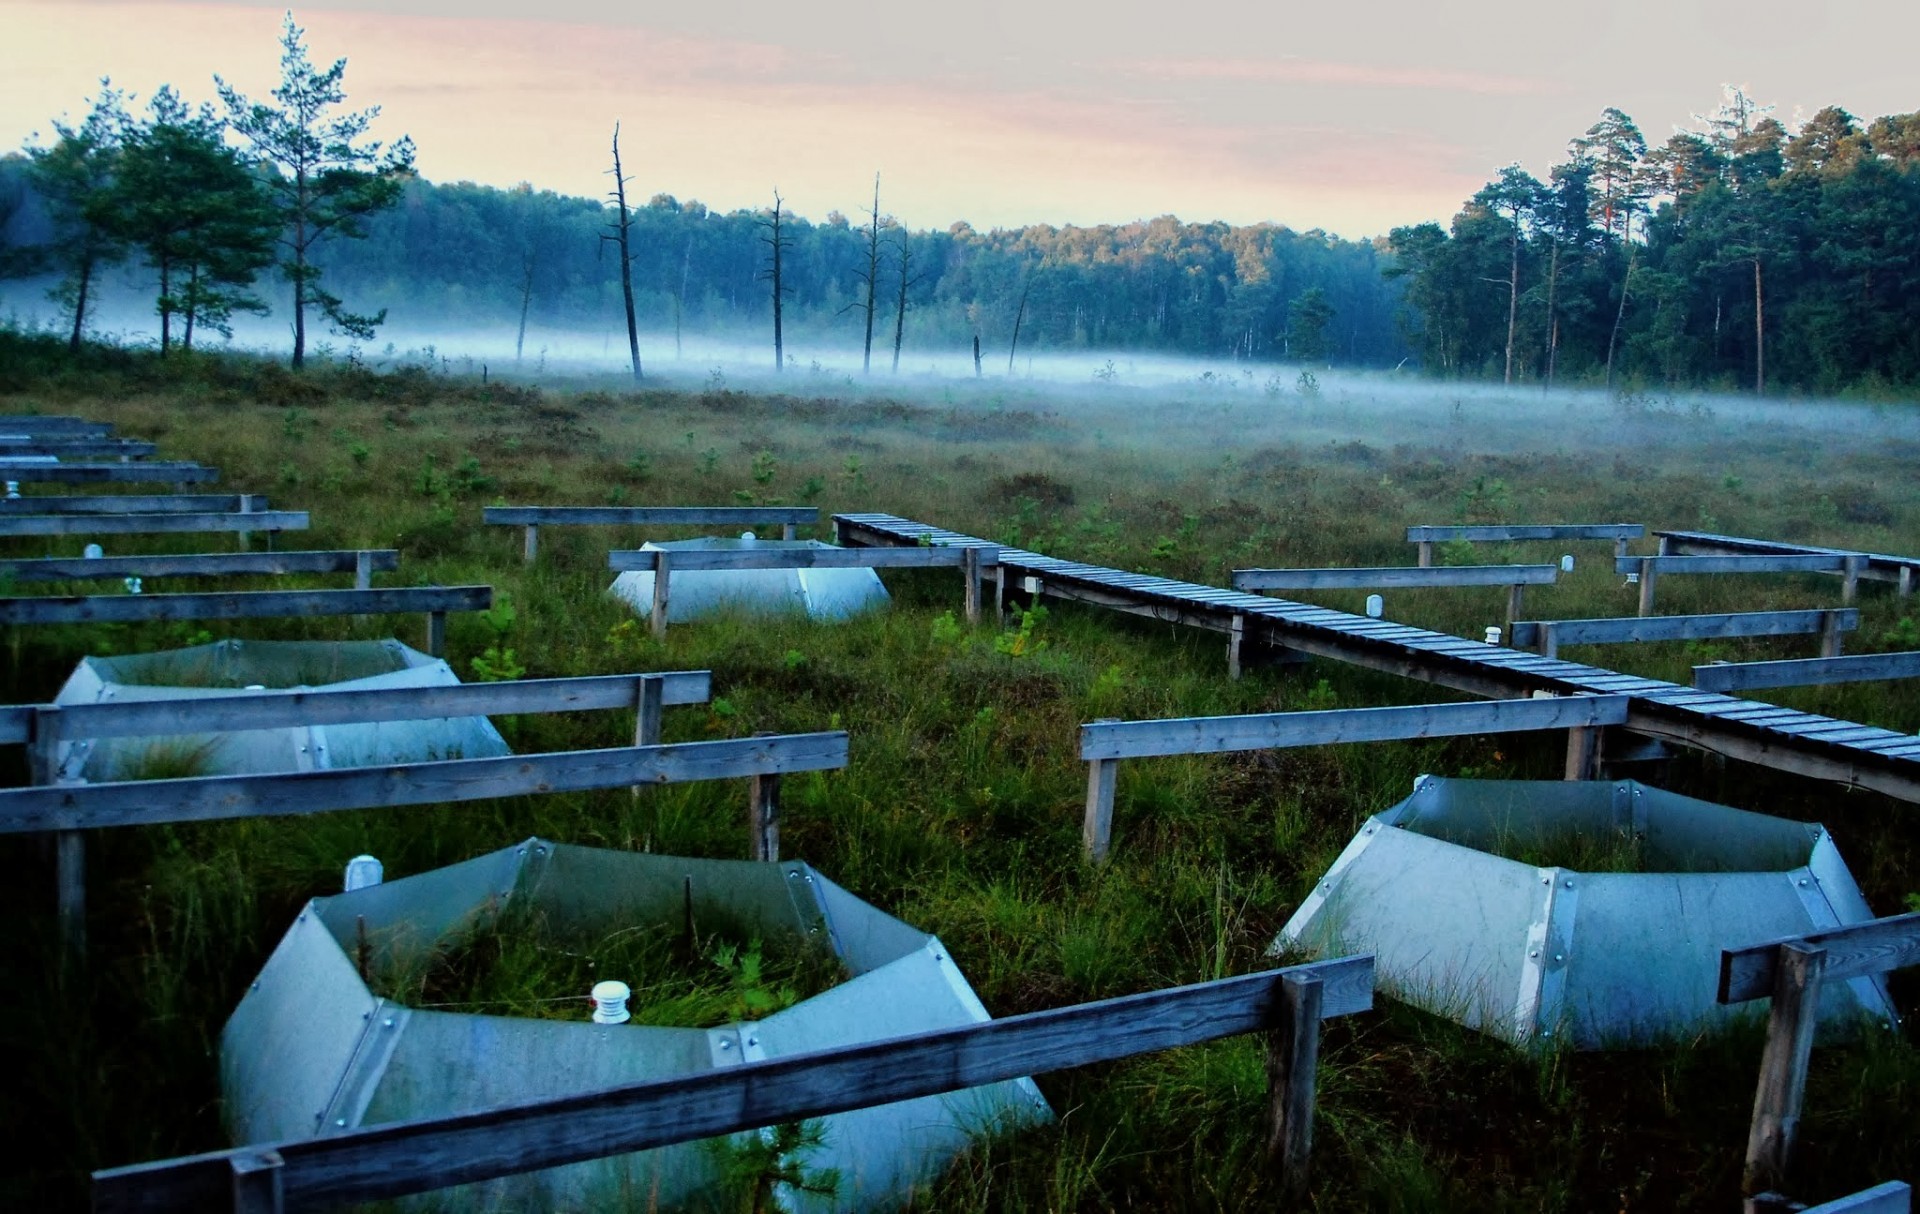
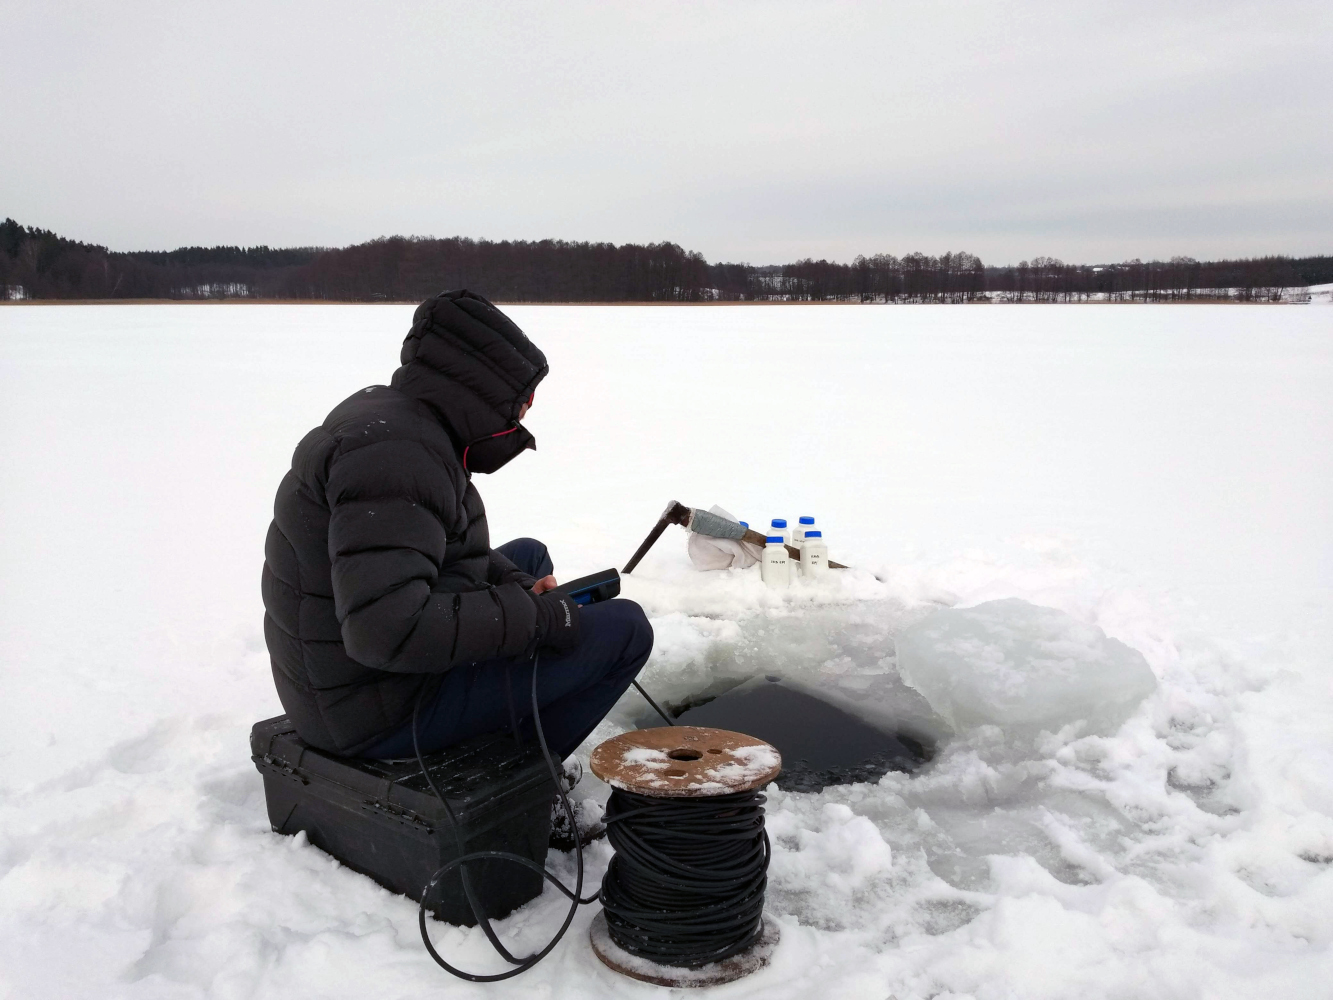
In practice, geographical analyses often combine many data sources, because each of them describes a different aspect of reality and has different limitations. Most are proxies…
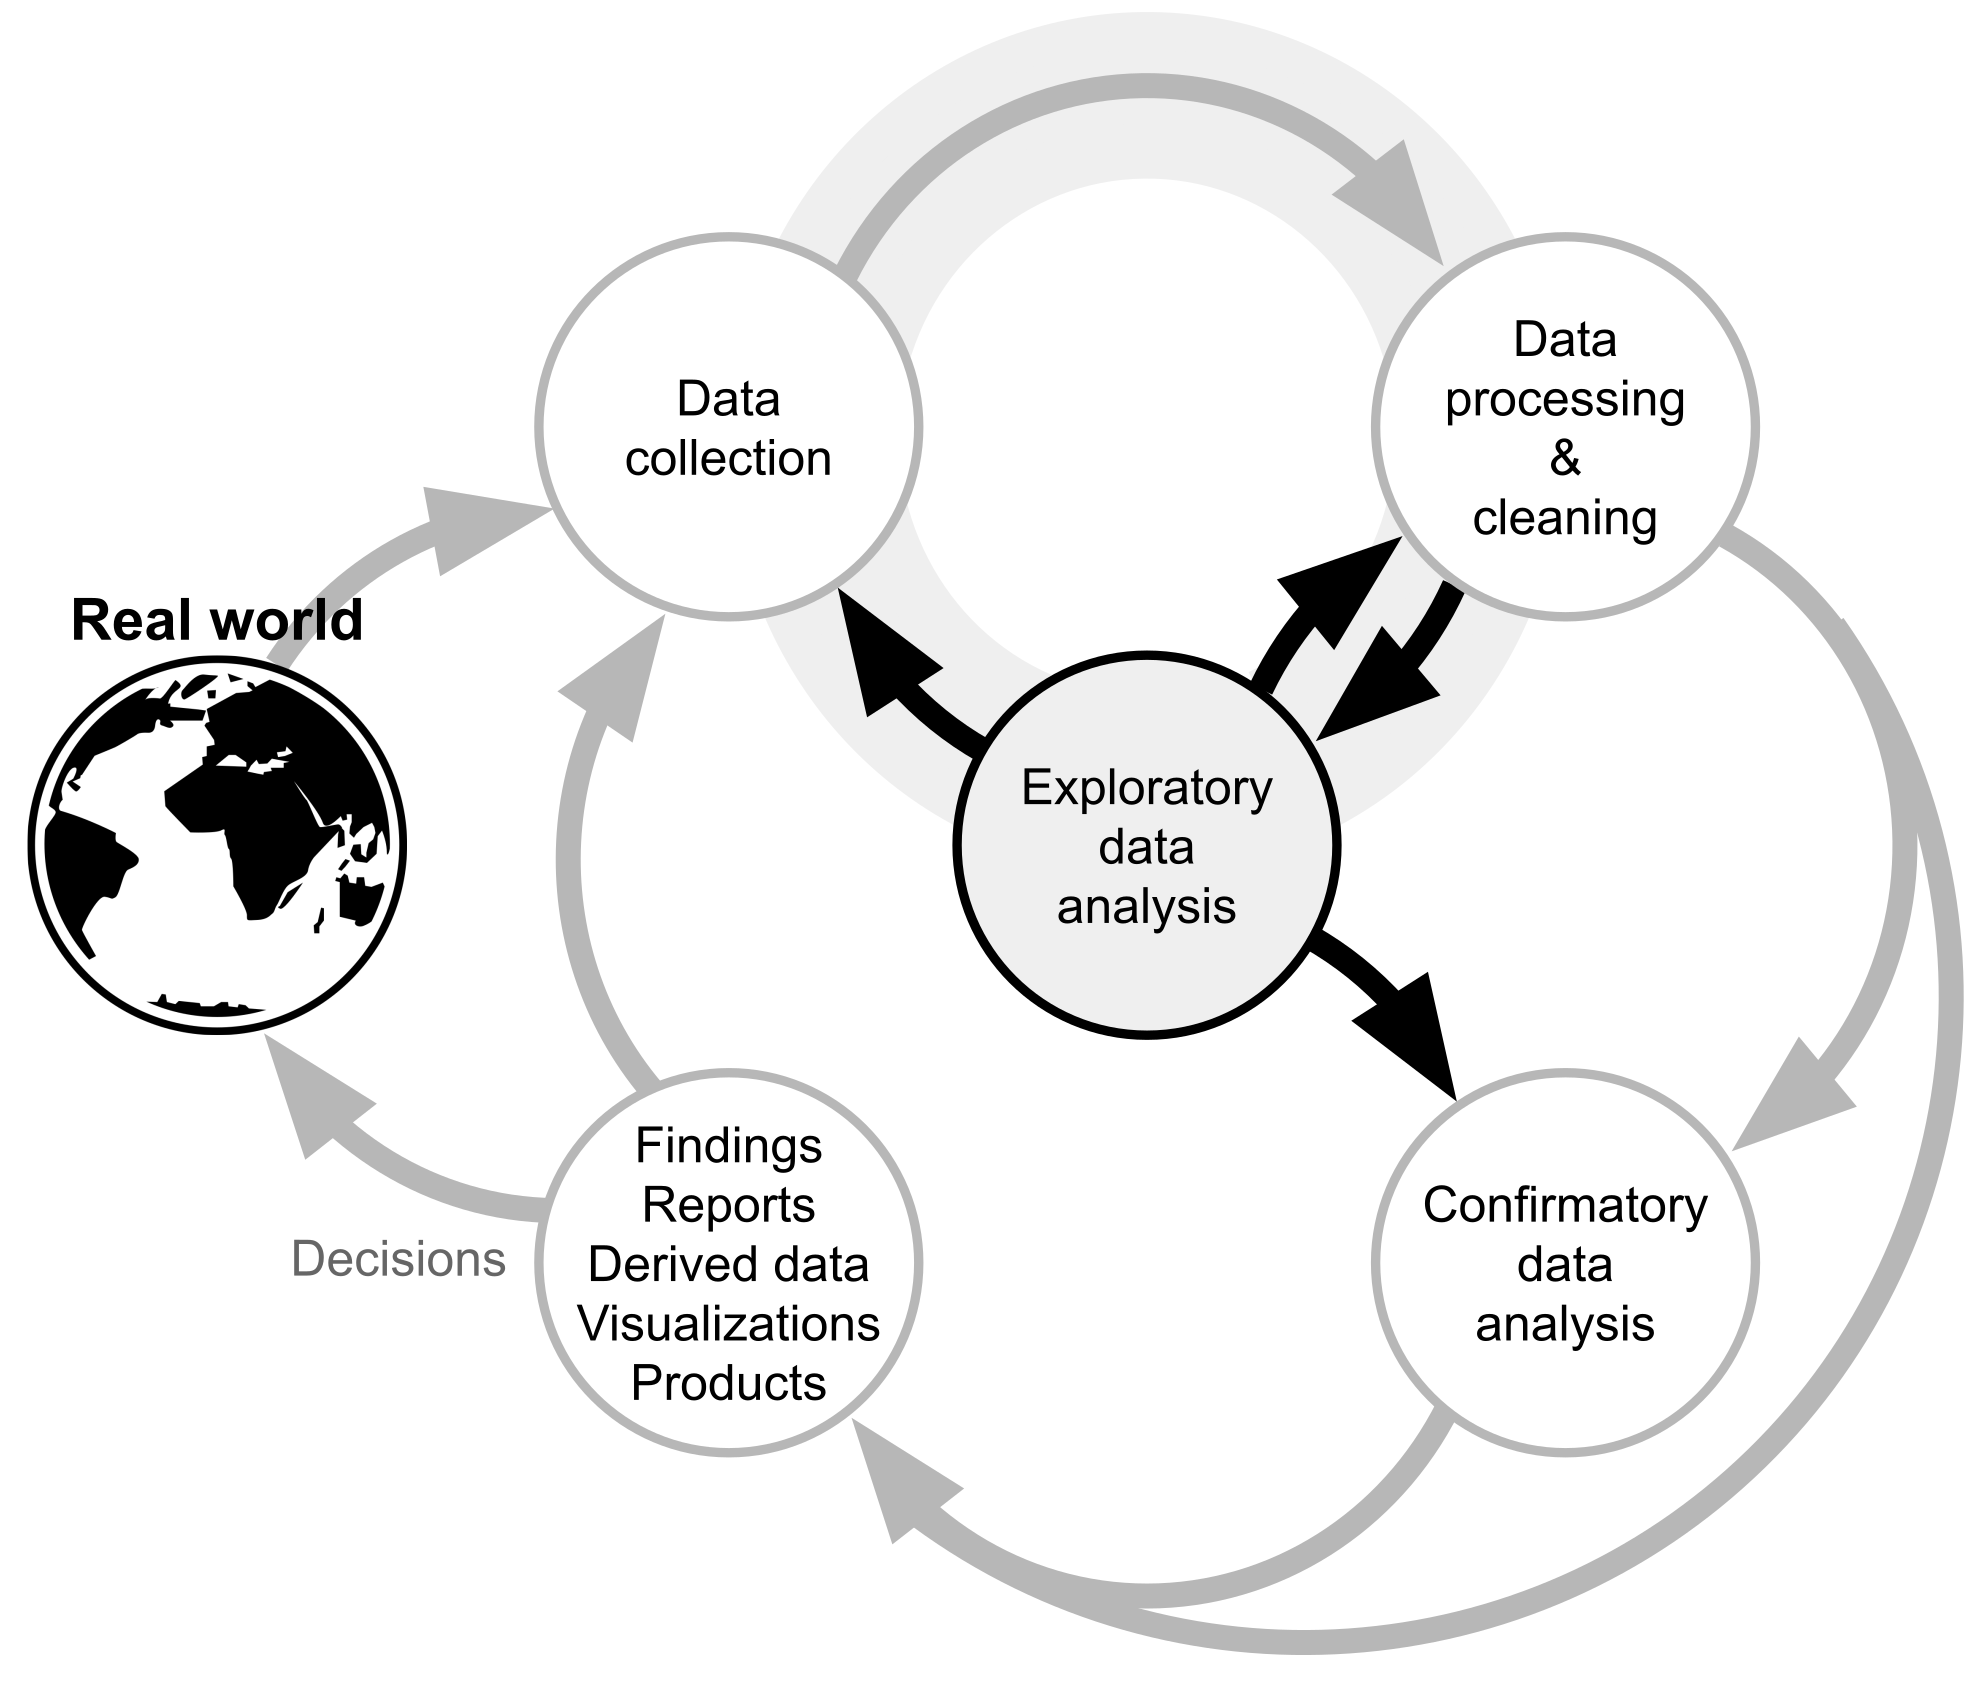
Data science workflow also applies
What distinguishes spatial data from other data?
- Location: Each object is associated with a specific location on the Earth’s surface
- Spatial relationships: Adjacency, distance, topology
- Multidimensionality: 2D, 3D, 4D (space + time)
In tabular data, the order of rows usually does not matter.
In spatial data, position and relationships between objects are part of the information.
Specific challenges:
- Spatial autocorrelation (including violations of independence assumptions)
- Spatial heterogeneity
- Spatial scales
- MAUP (Modifiable Areal Unit Problem)
(Spatial data, and maps, serve many purposes, including exploratory data analysis, communication, and decision support.)
A brief history of R spatial capabilities
R has a long history of supporting spatial data processing, analysis, and visualization
Spatial analysis in R grew from early work in the S language (1990s; Ripley and others)
By ~2000, R/S already supported point patterns, geostatistics, ESDA, and spatial econometrics
Early packages laid the foundation for spatial statistics in R
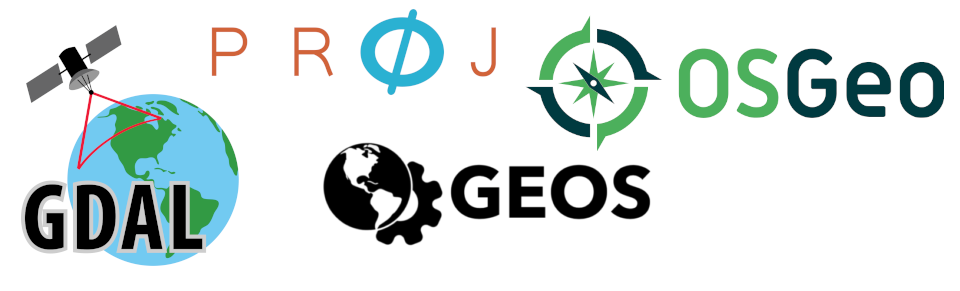
Later development, led by Bivand and Pebesma, integrated with broader geospatial ecosystems (e.g., GDAL, GEOS), and shaped modern R geospatial workflows
The current R spatial ecosystem
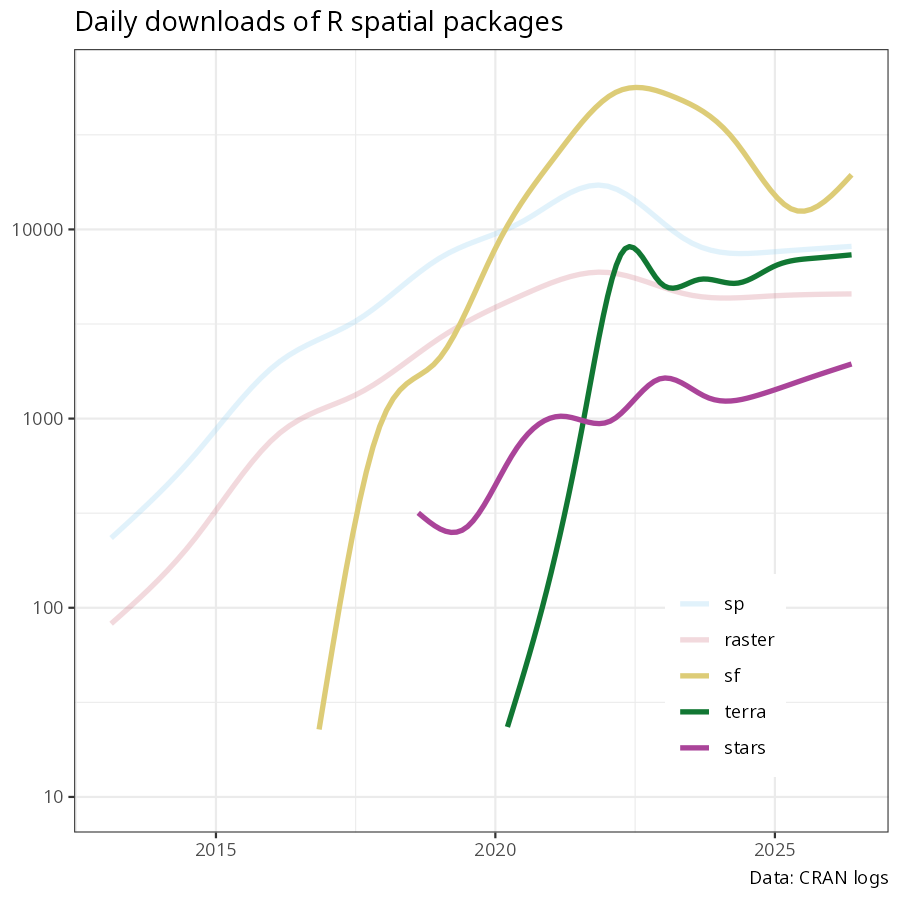
Core packages: sf, terra, stars (but also gdalraster, geos, wk, etc.)
Visualization: tmap, ggplot2, leaflet, mapview, mapsf, …
Analysis: spatstat, gstat, spdep, spatialreg, landscapemetrics, sits, …
New kids on the block: mapgl, a5R, duckspatial
Geocomputation with R (2016-…)
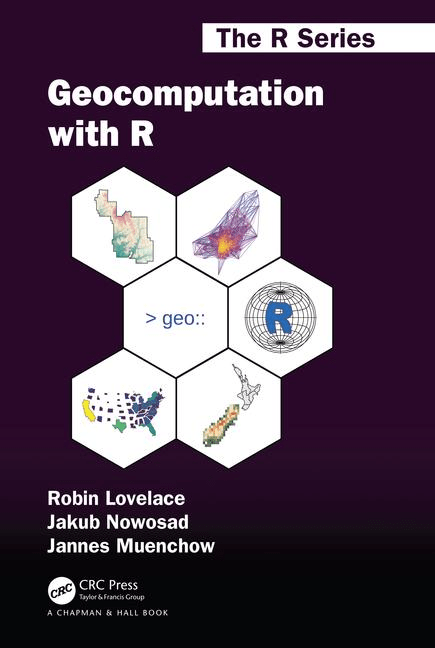
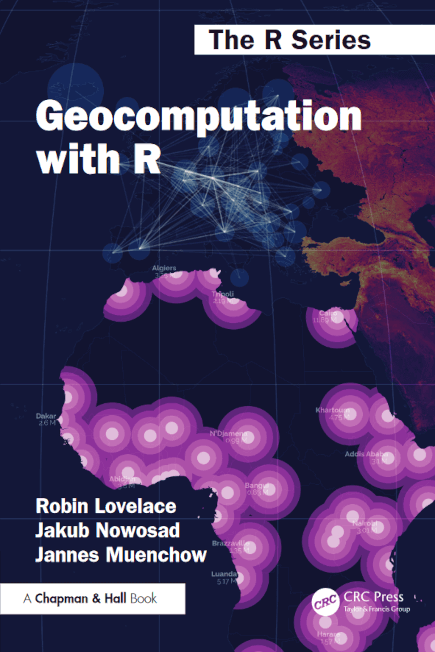
- A book promoting reproducible, modern geospatial analysis in R
- A website with reproducible solutions to exercises
- R package, geocompkg, to install dependencies
- R packages with example data: spData, spDataLarge
Translations (some made by the community, thank you!):
Strengths of R spatial ecosystem
We often cannot measure the whole area of interest
Extrapolation continuum
Predictive spatial machine learning
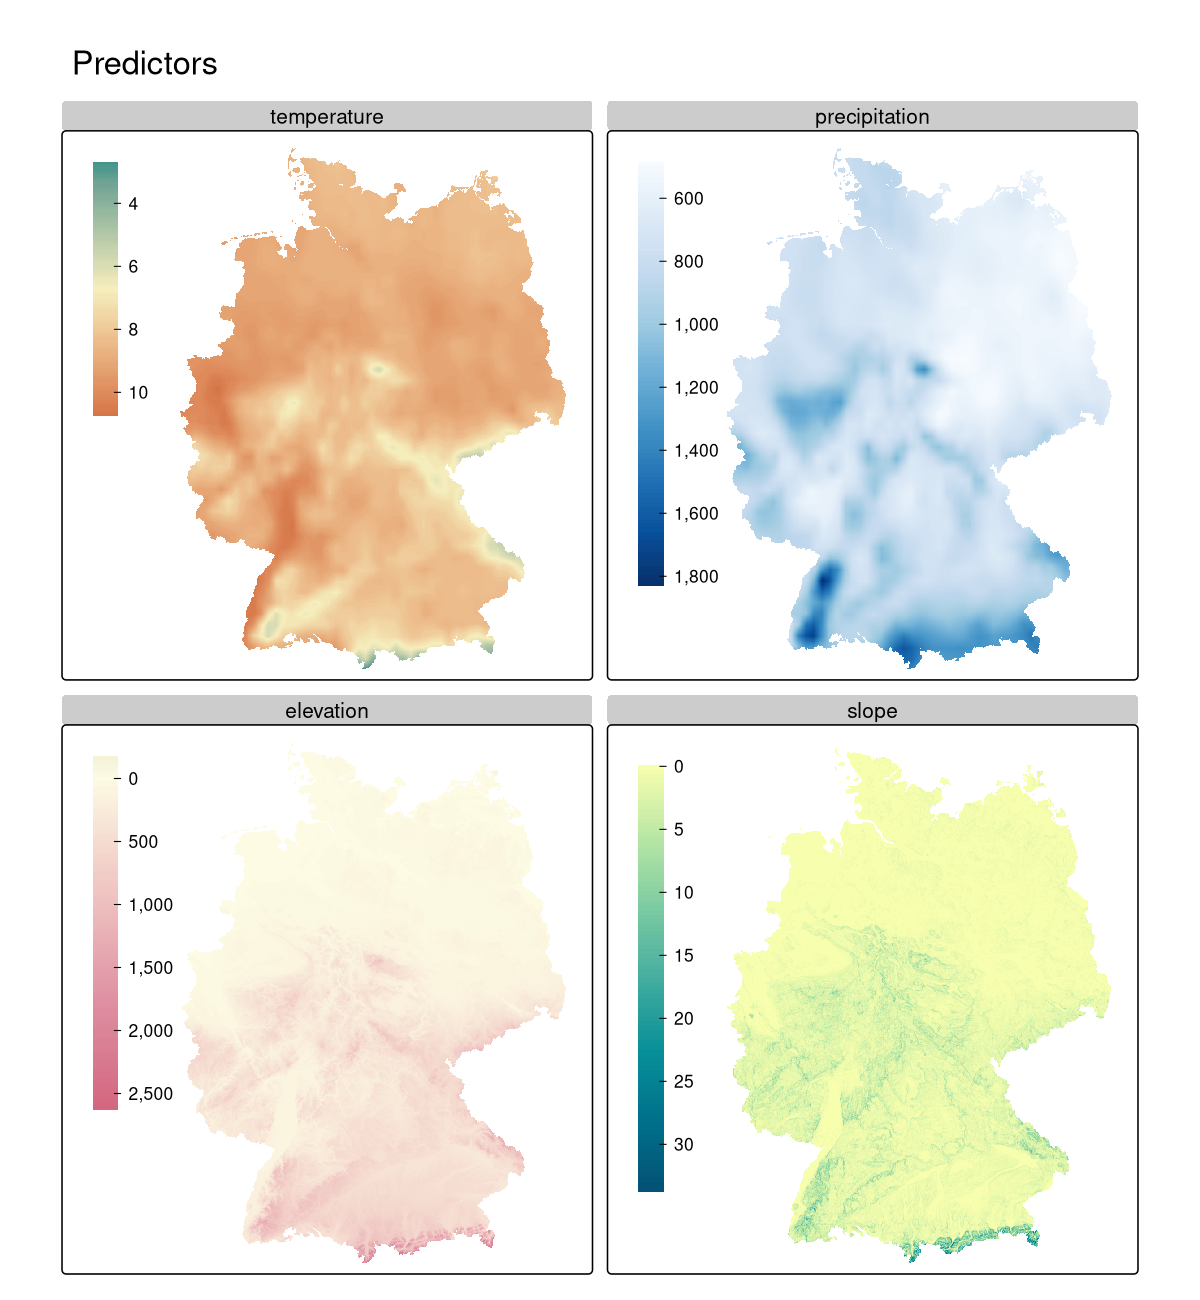
- We have a limited number of observations, and several predictors that cover the whole area of interest (e.g., satellite imagery, elevation, climate, etc.)
Predictive spatial machine learning
- We are interested in mapping across the spatial domain
- We train a model on the available observations and use it to predict across the whole area of interest
- We then evaluate the model using a validation set
- Thus, we should evaluate the map, not the model
Identification of regions of reliable prediction
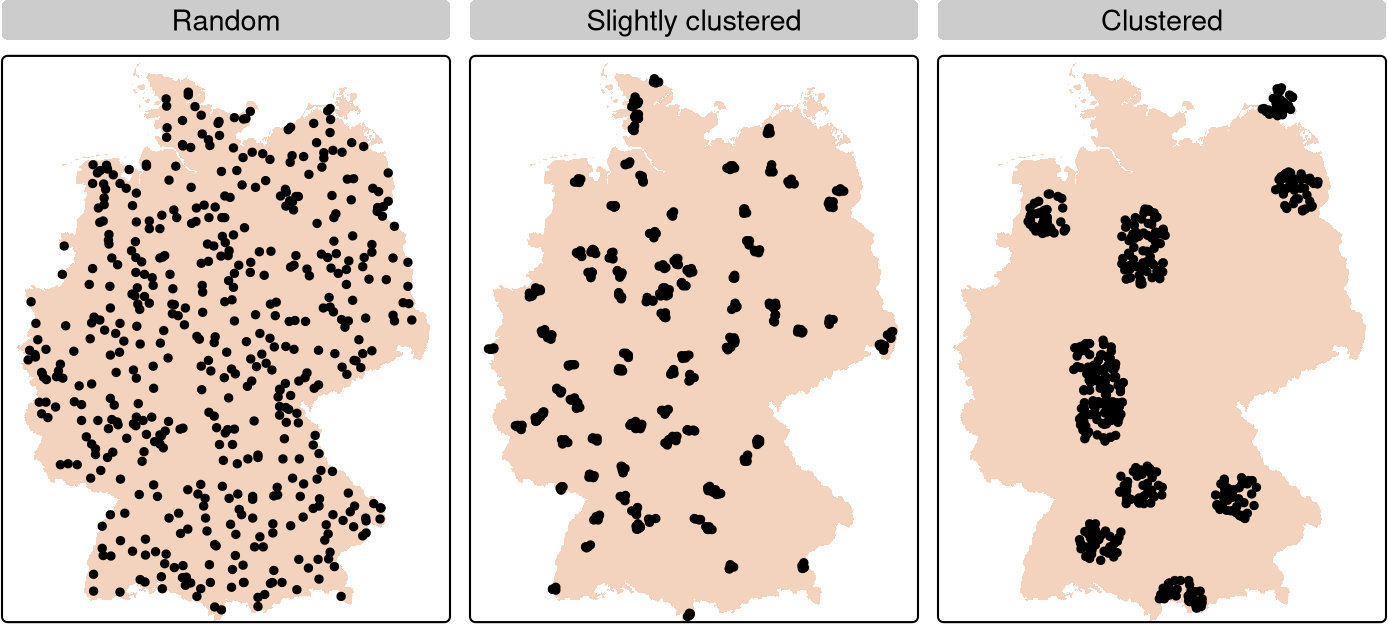
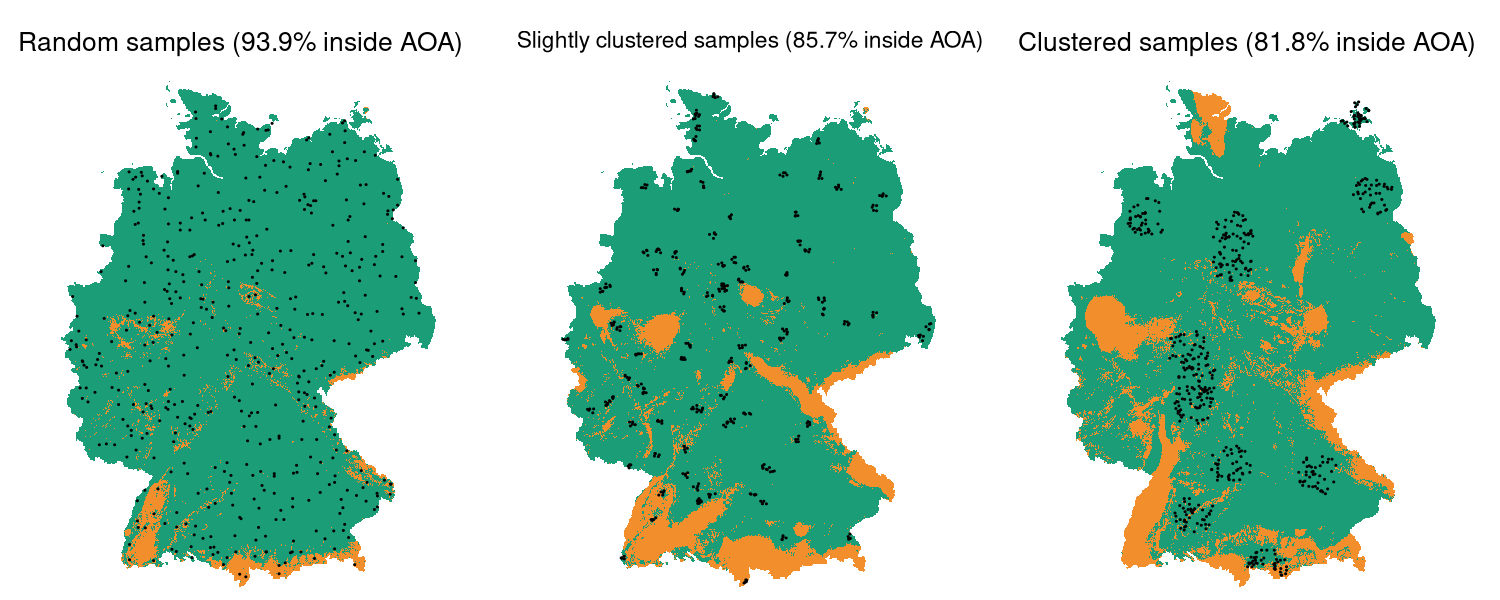
Area of applicability (AoA, Meyer and Pebesma, 2021) for different sampling designs
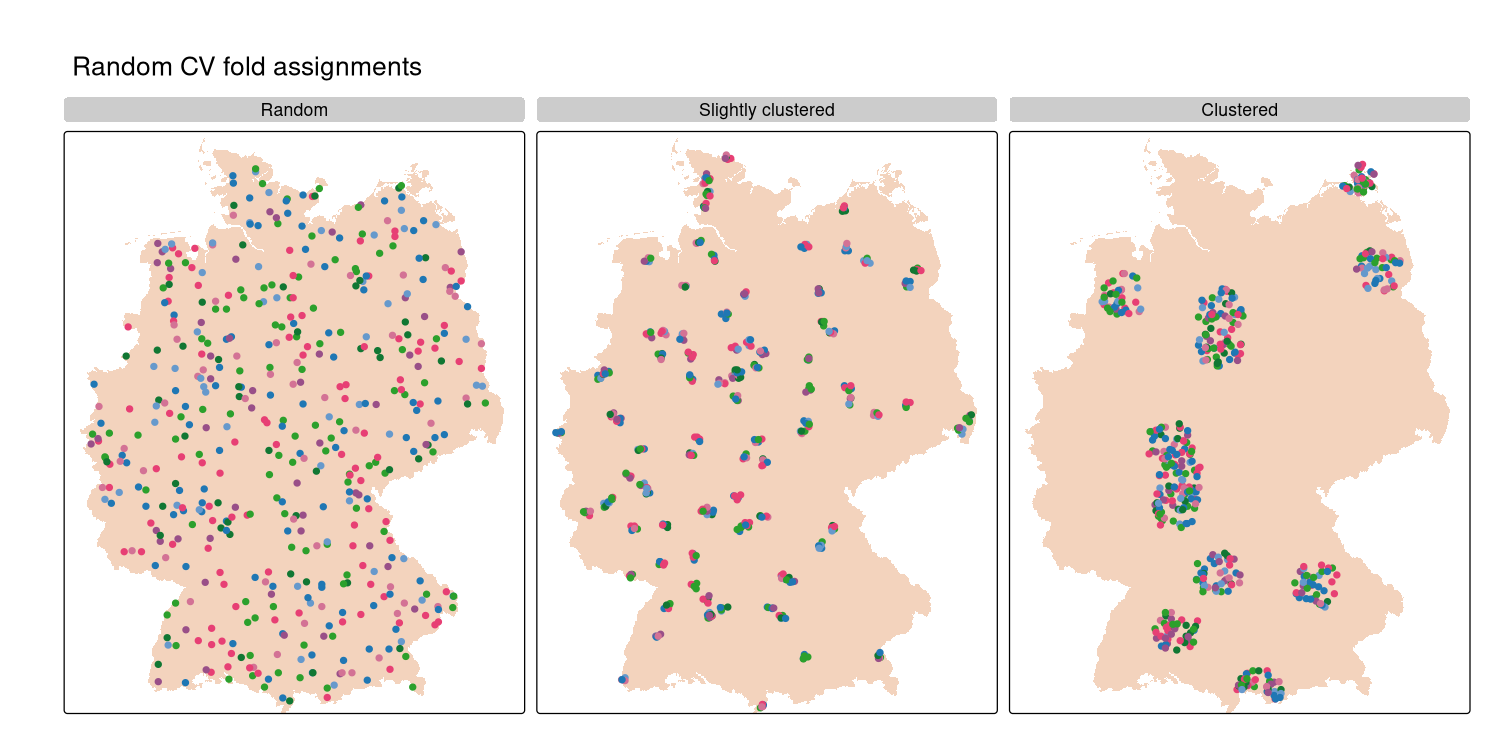
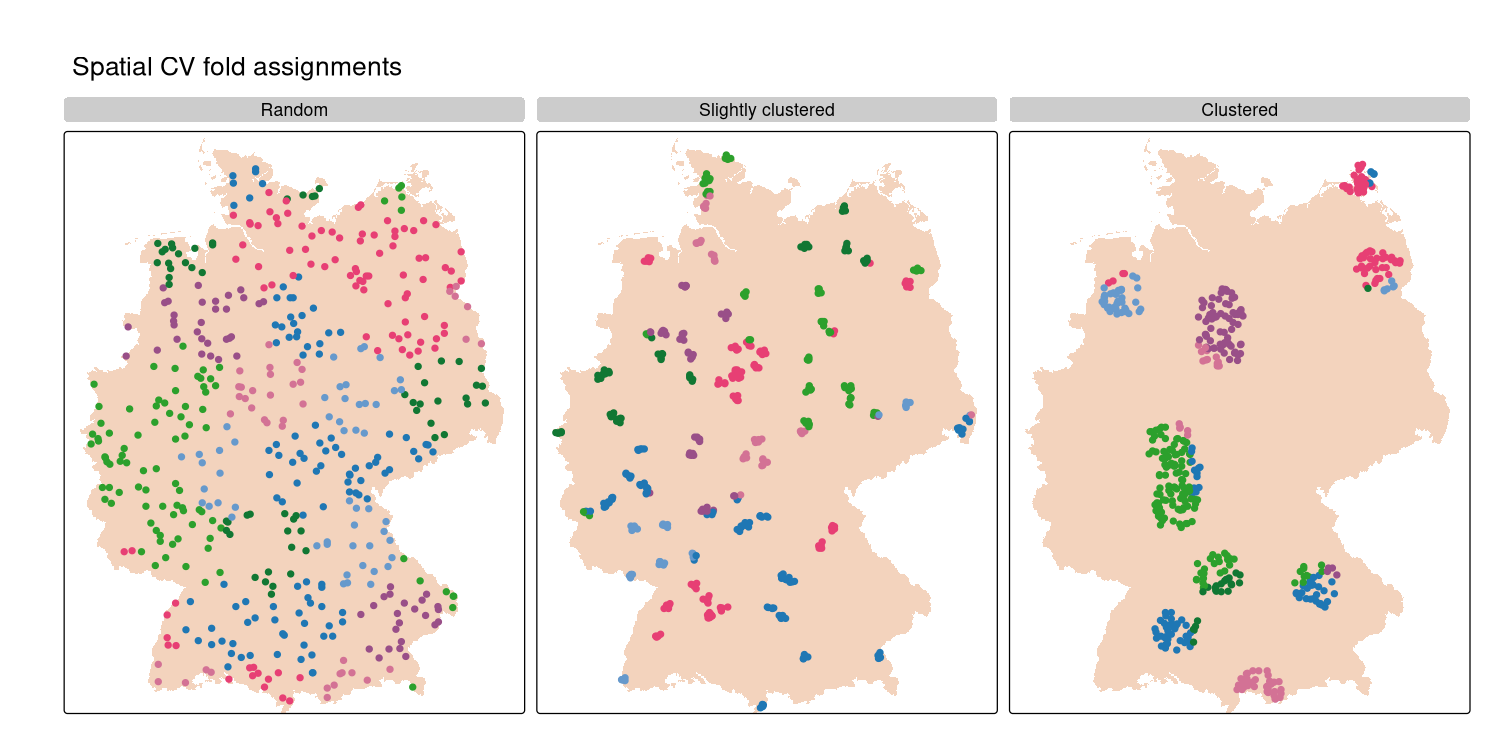
Evaluation strategies
Alternative: adaptive evaluation
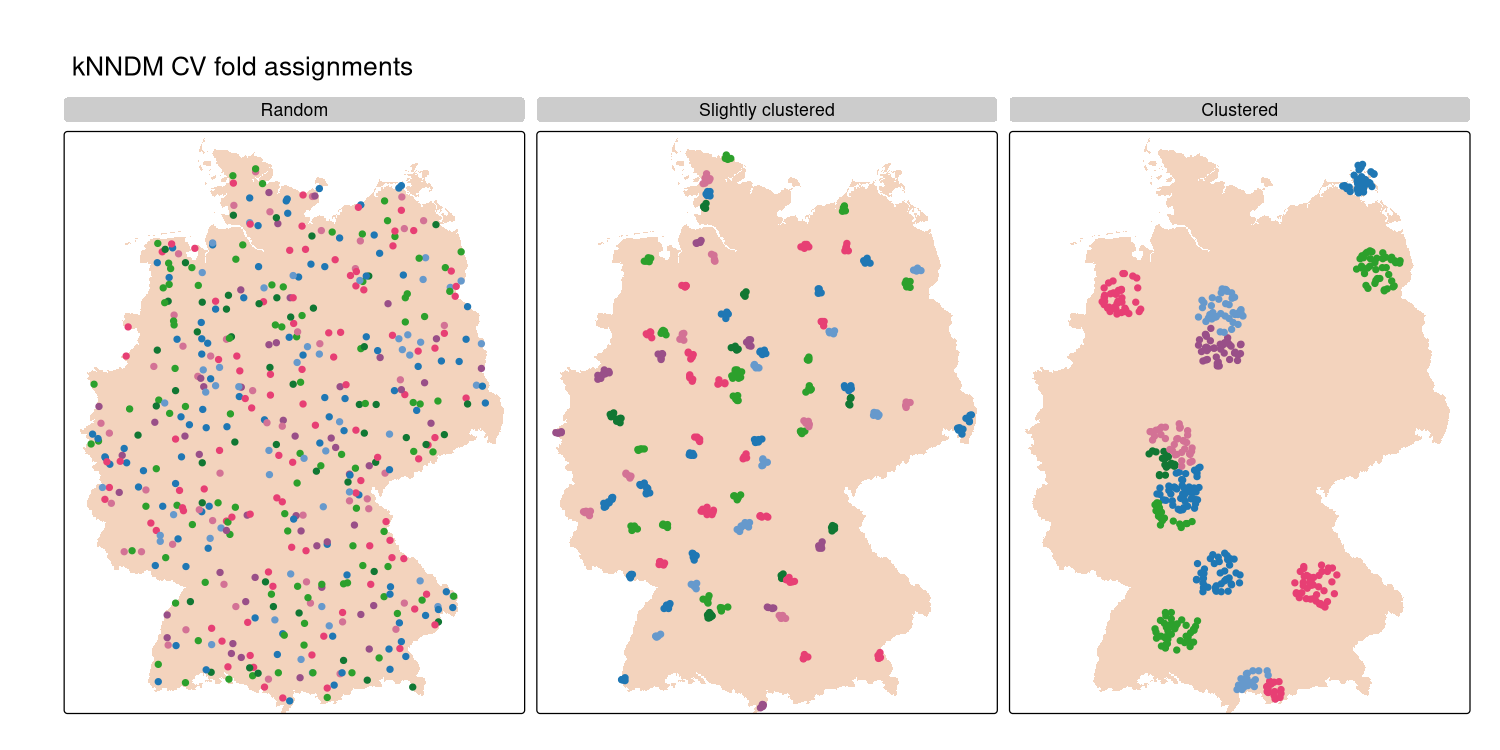
k-fold Nearest Neighbor Distance Matching (kNNDM, Linnenbrink et al., 2024) matches folds to the prediction scenario using distance structure (either in geographic or predictor space).
How our evaluations compare to the truth
Evaluation results for different validation strategies
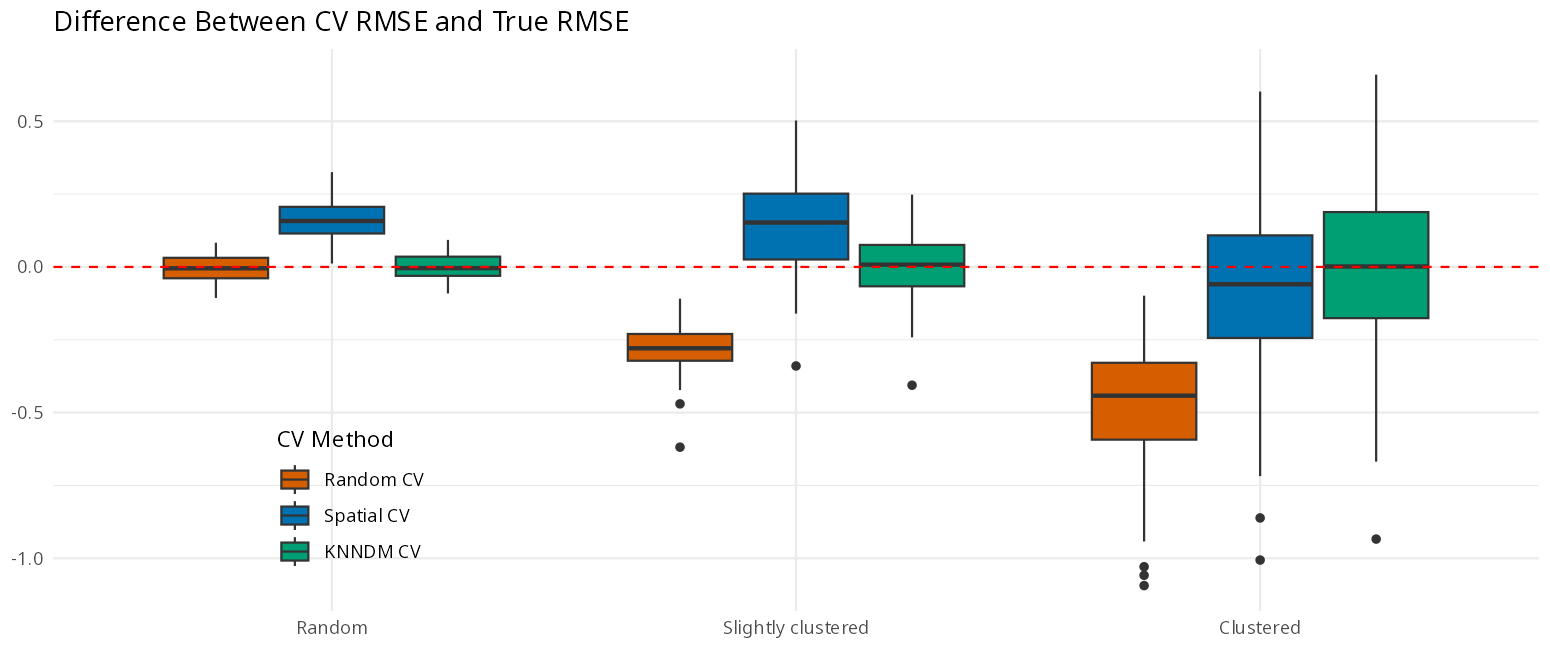
Prediction-domain adaptive evaluation
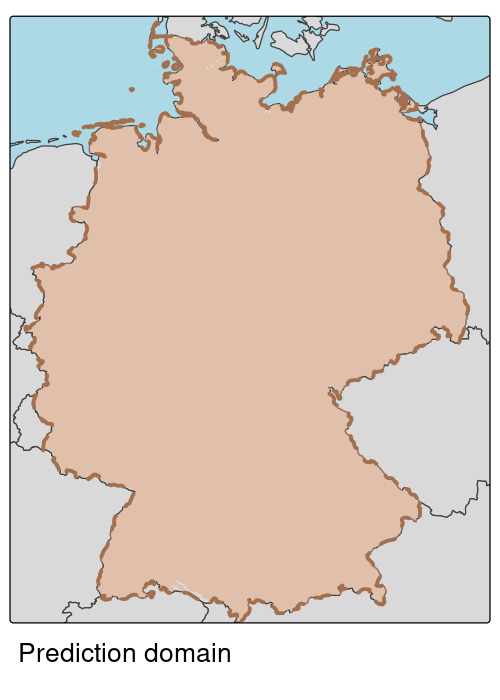
- Define the prediction domain
- Construct validation folds that reflect the prediction domain
- (Weight validation samples by their prevalence in the prediction domain)


The rcartocolor package
It provides color schemes for maps and other graphics designed by the CARTO company.
(And it taught me a lot about how to create an R package.)
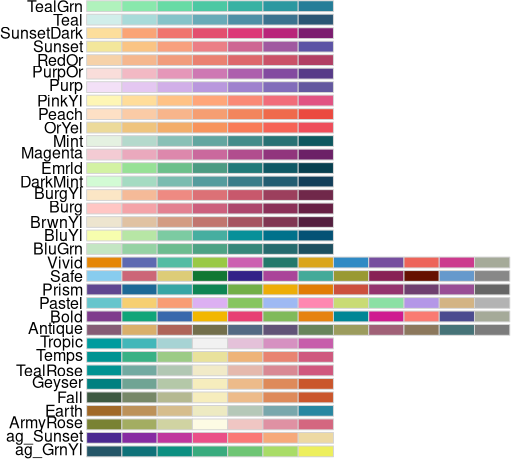

R approaches to color vision deficiency
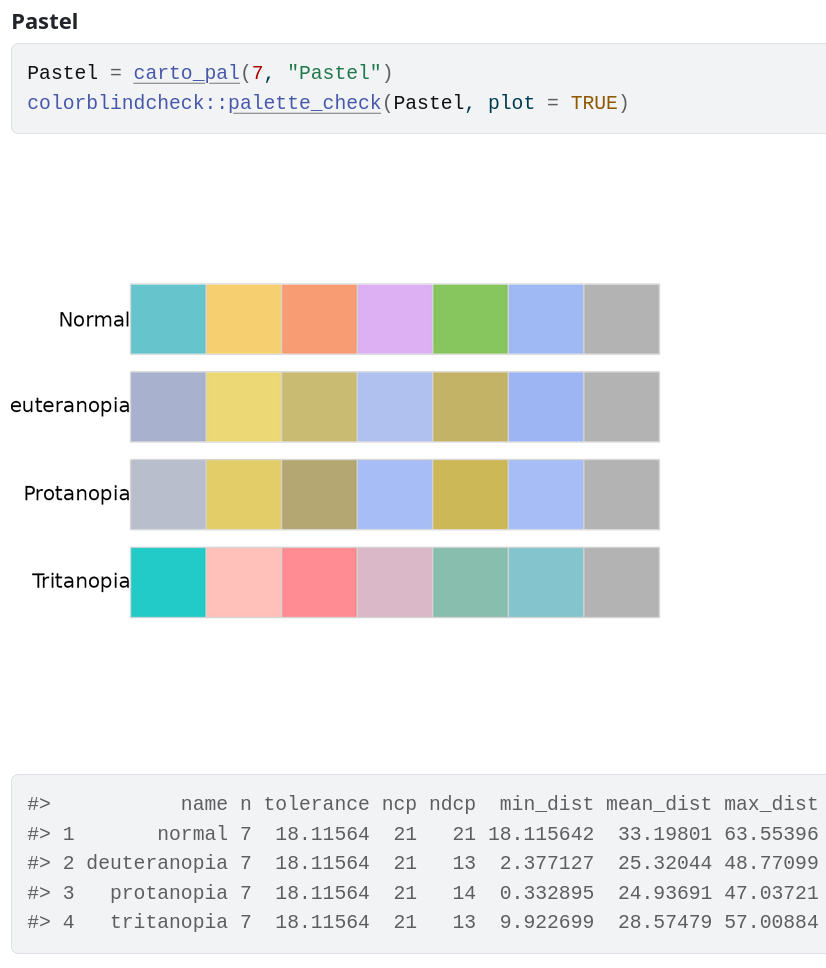
Color vision deficiency simulation:
colorblindr, colorBlindness
Palette quality assessment:
colorblindcheck
Colorblind-friendly palettes:
viridis, rcartocolor
Image recoloring tools:
cblindplot
Many related tools:
colorspace, cols4all
Map colors
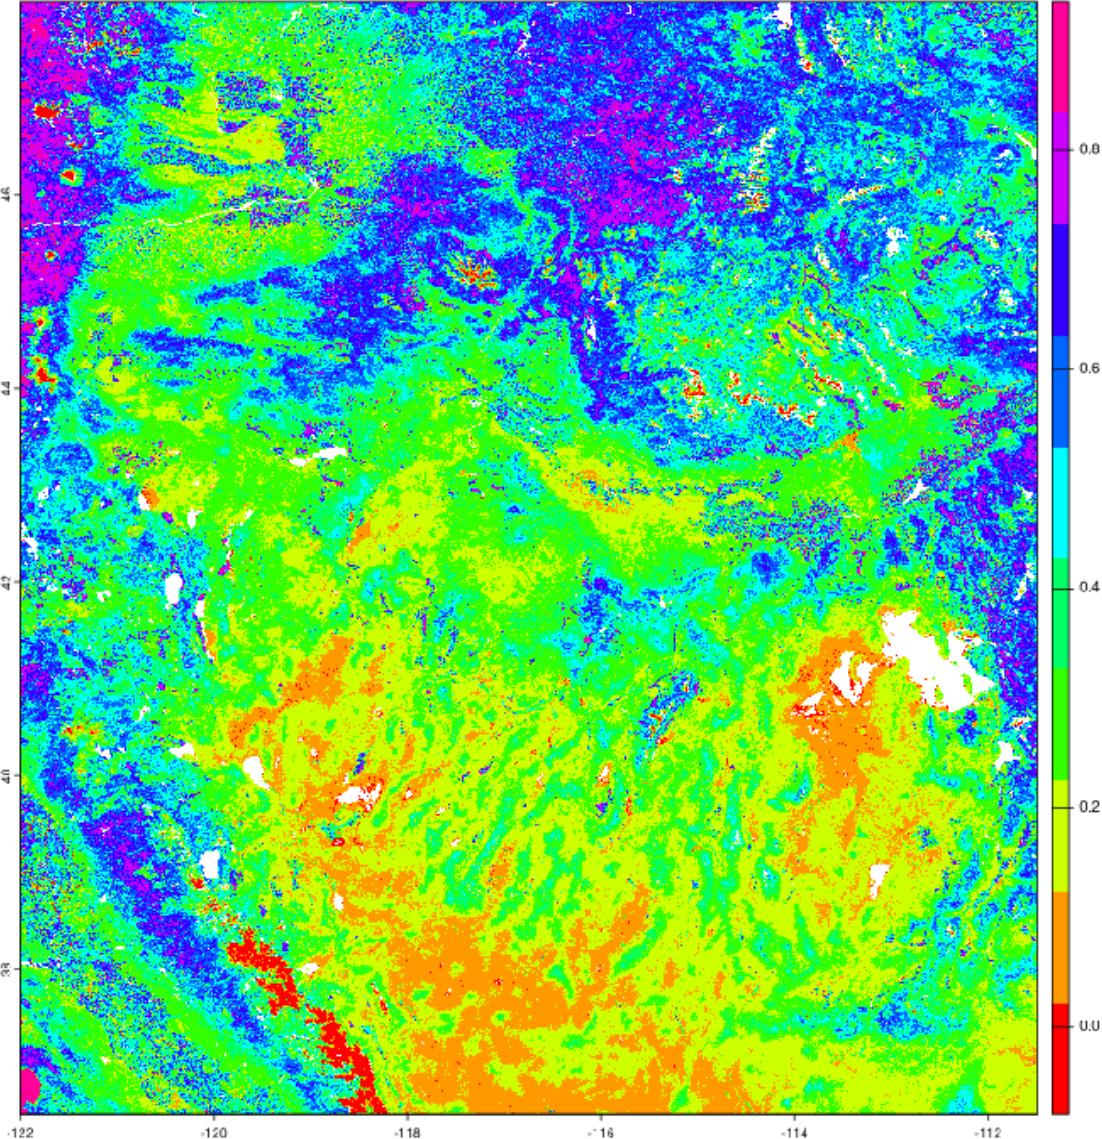
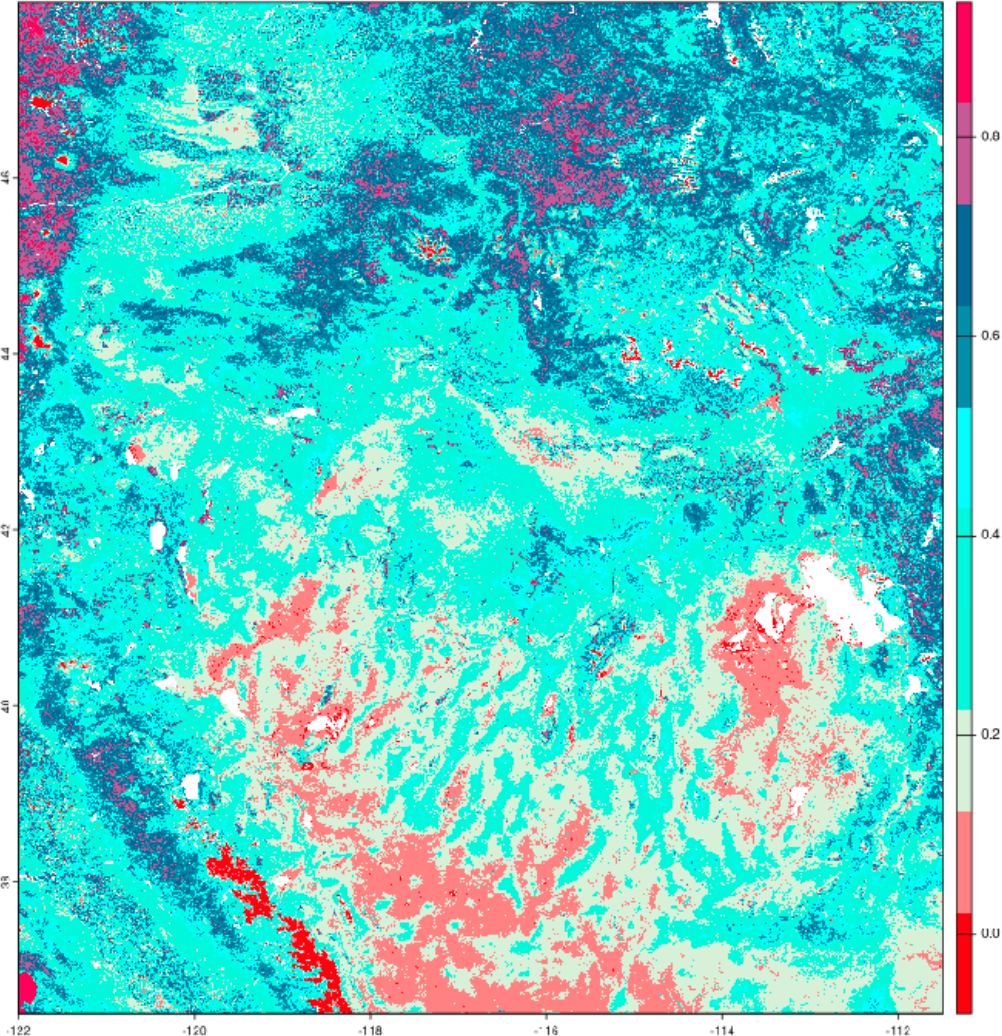
There are enough green-red and rainbow colored maps in the world.
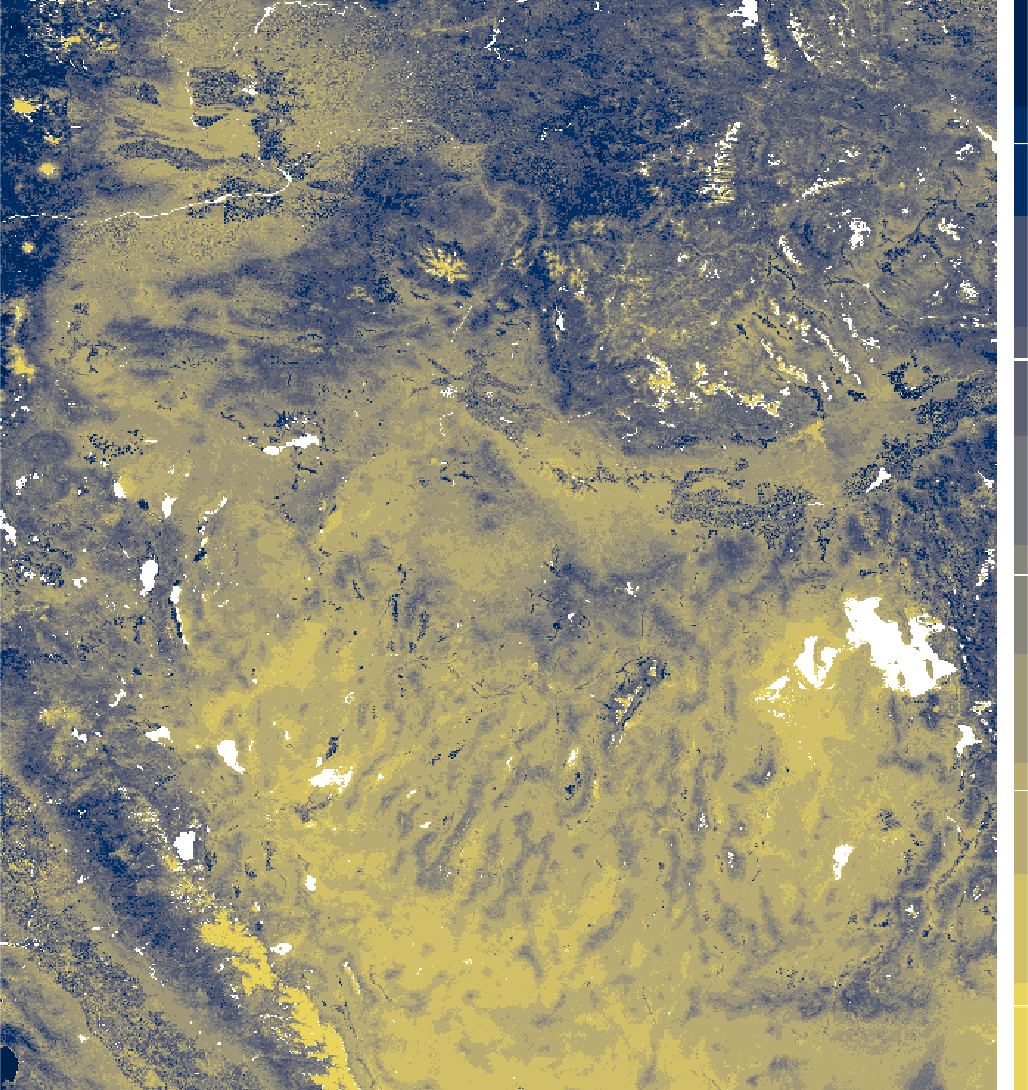
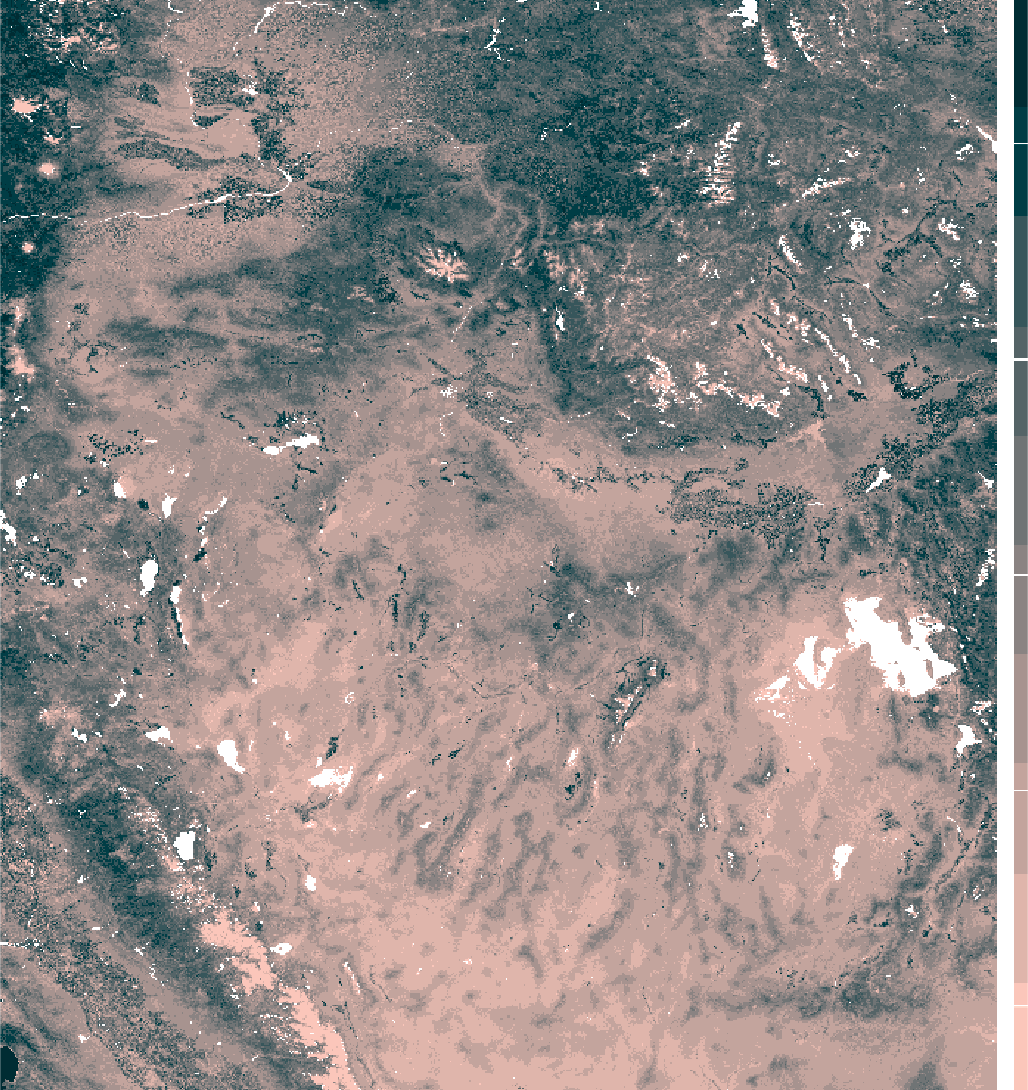
cblindplot::cblind.plot(map, legend = my_legend)
Map projections
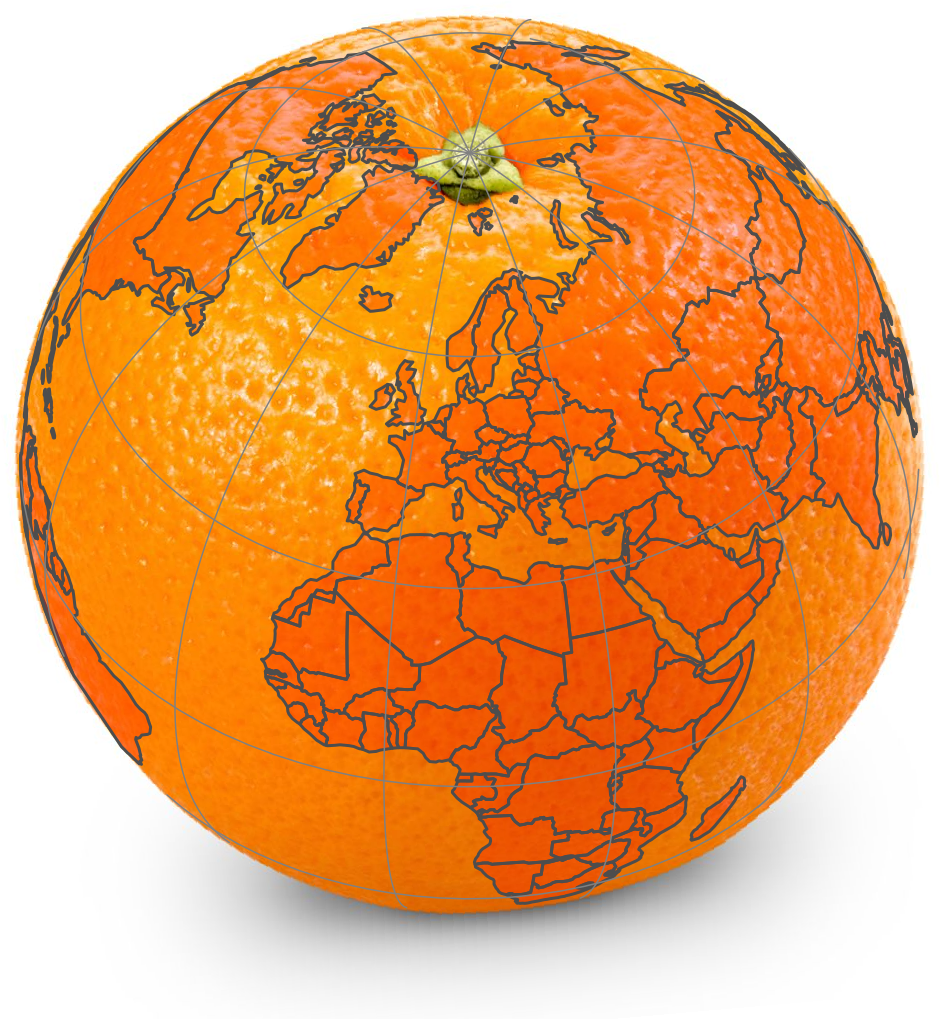
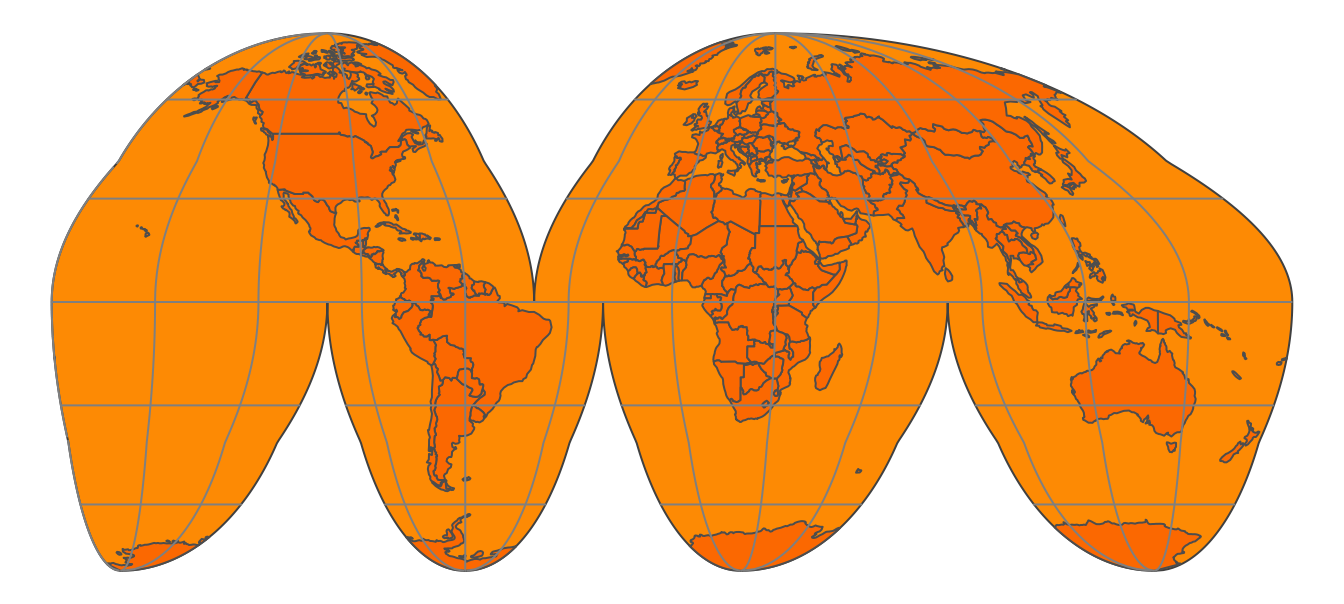
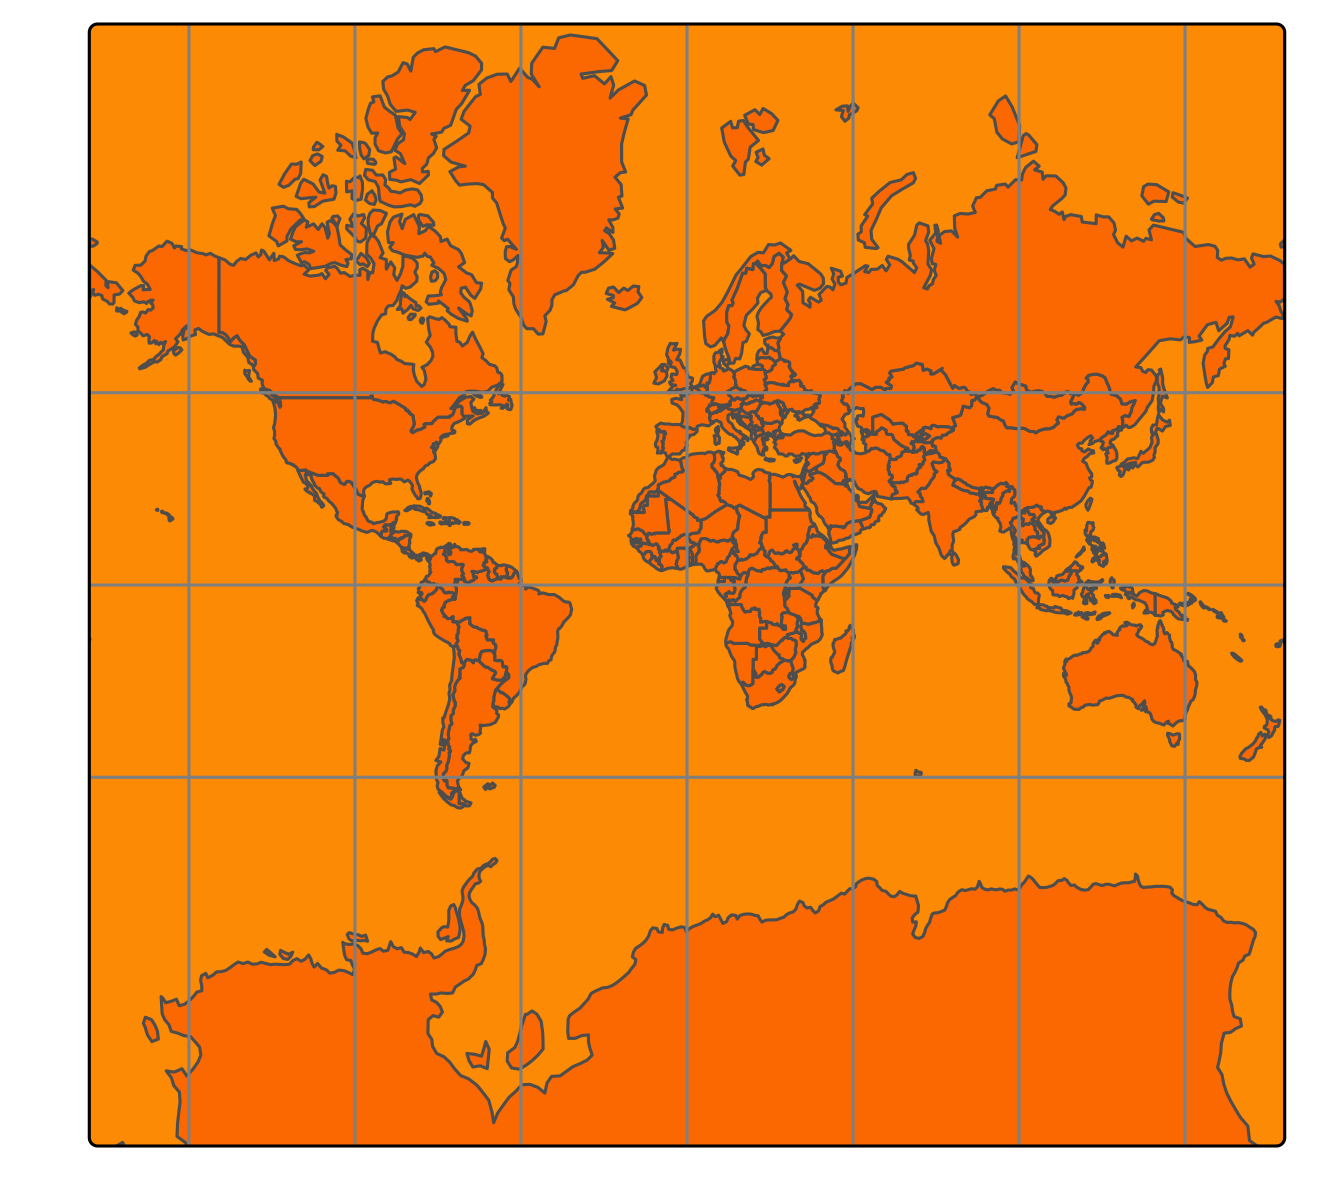
Map distortions… and their consequences
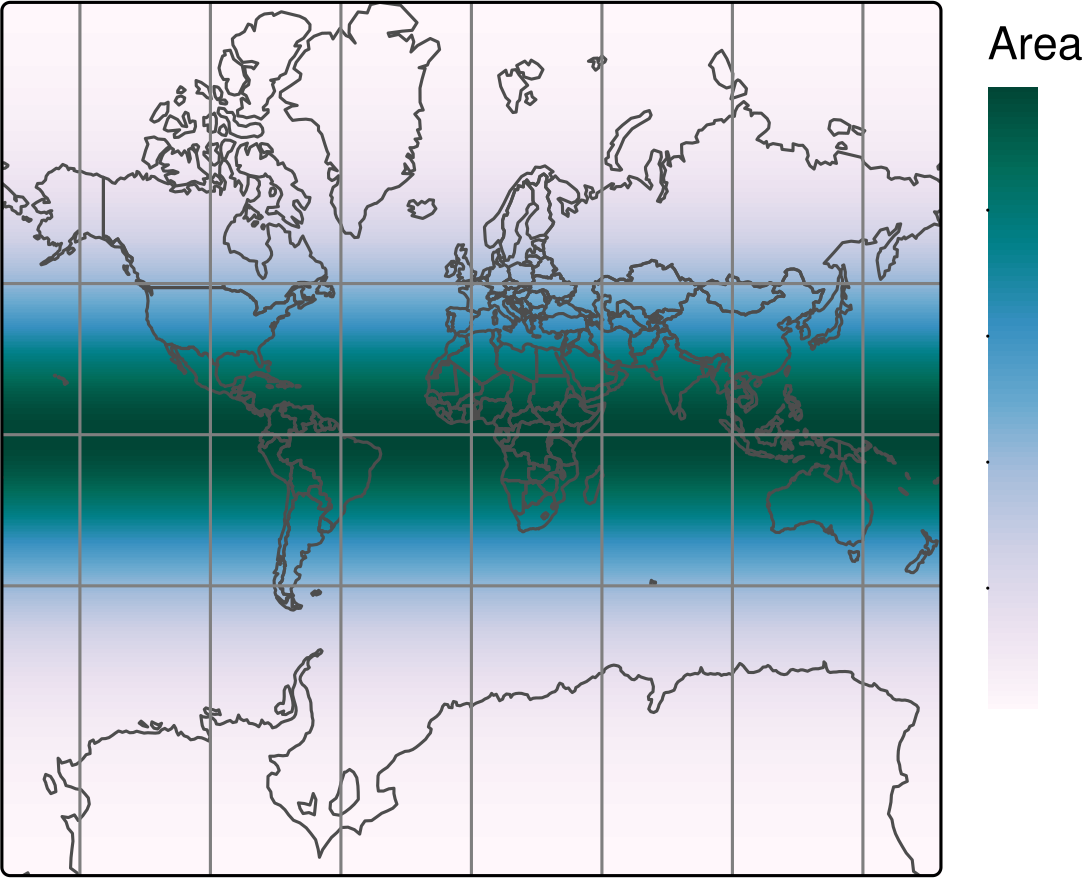
In 2018, inspired by the work of Neil Kaye, I wrote a blog post with R code to show distortions of the Mercator projection.
I also shared the resulting gif on Wikipedia.
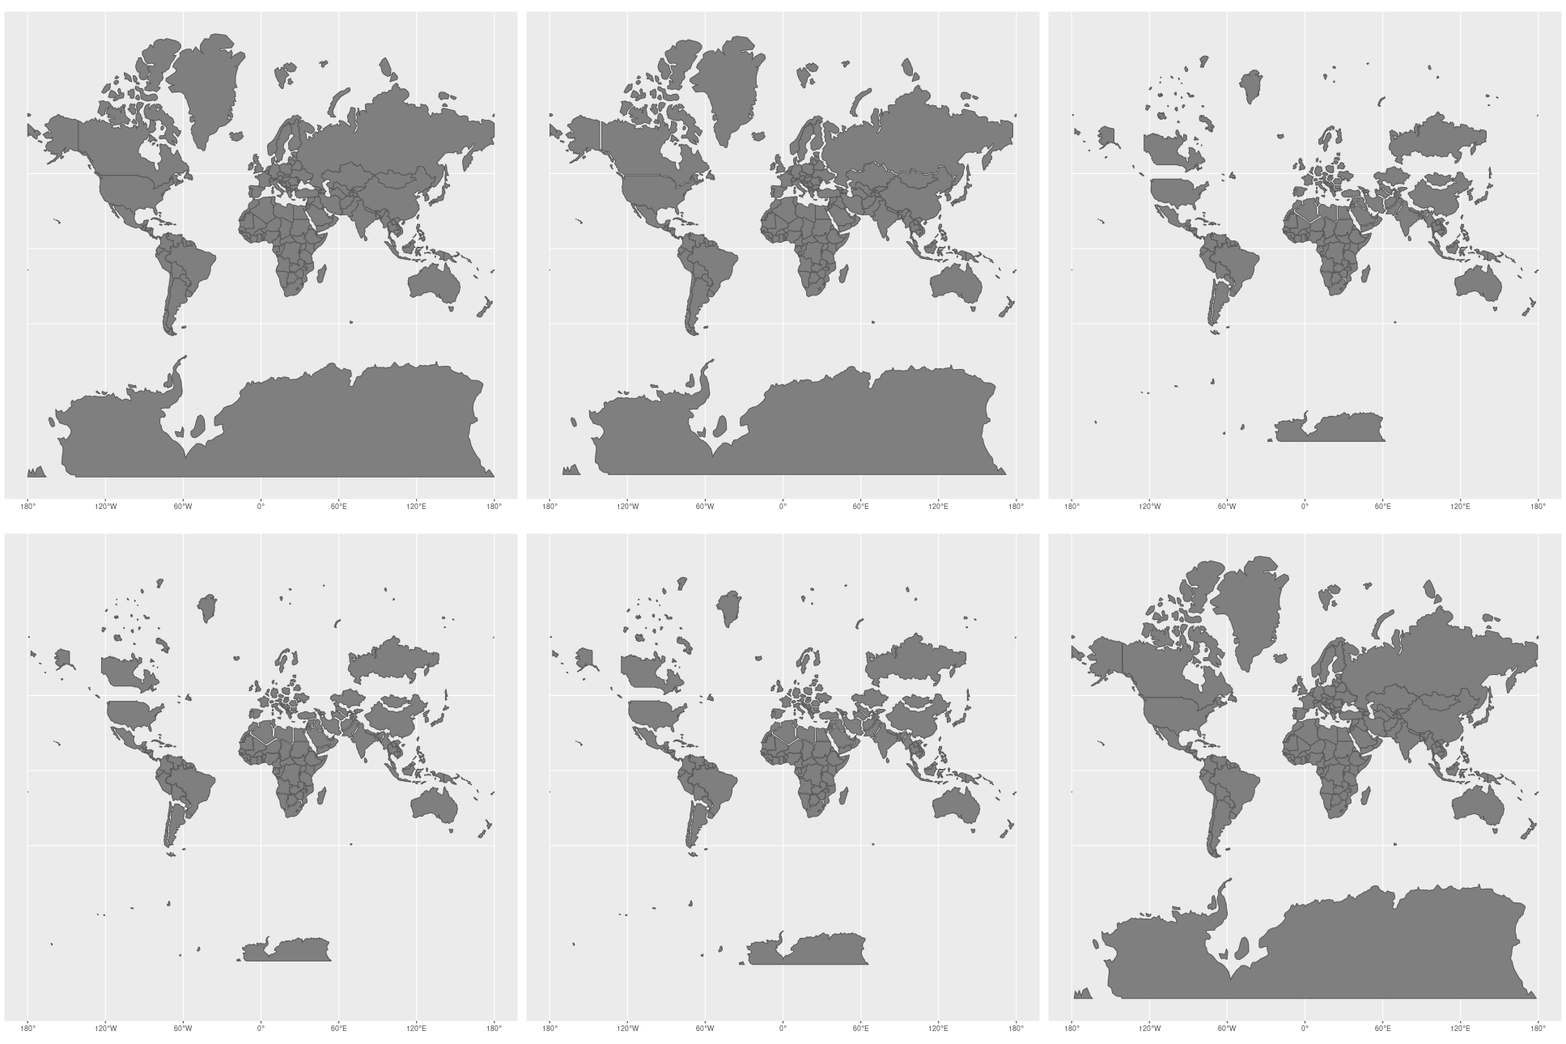
… and their consequences
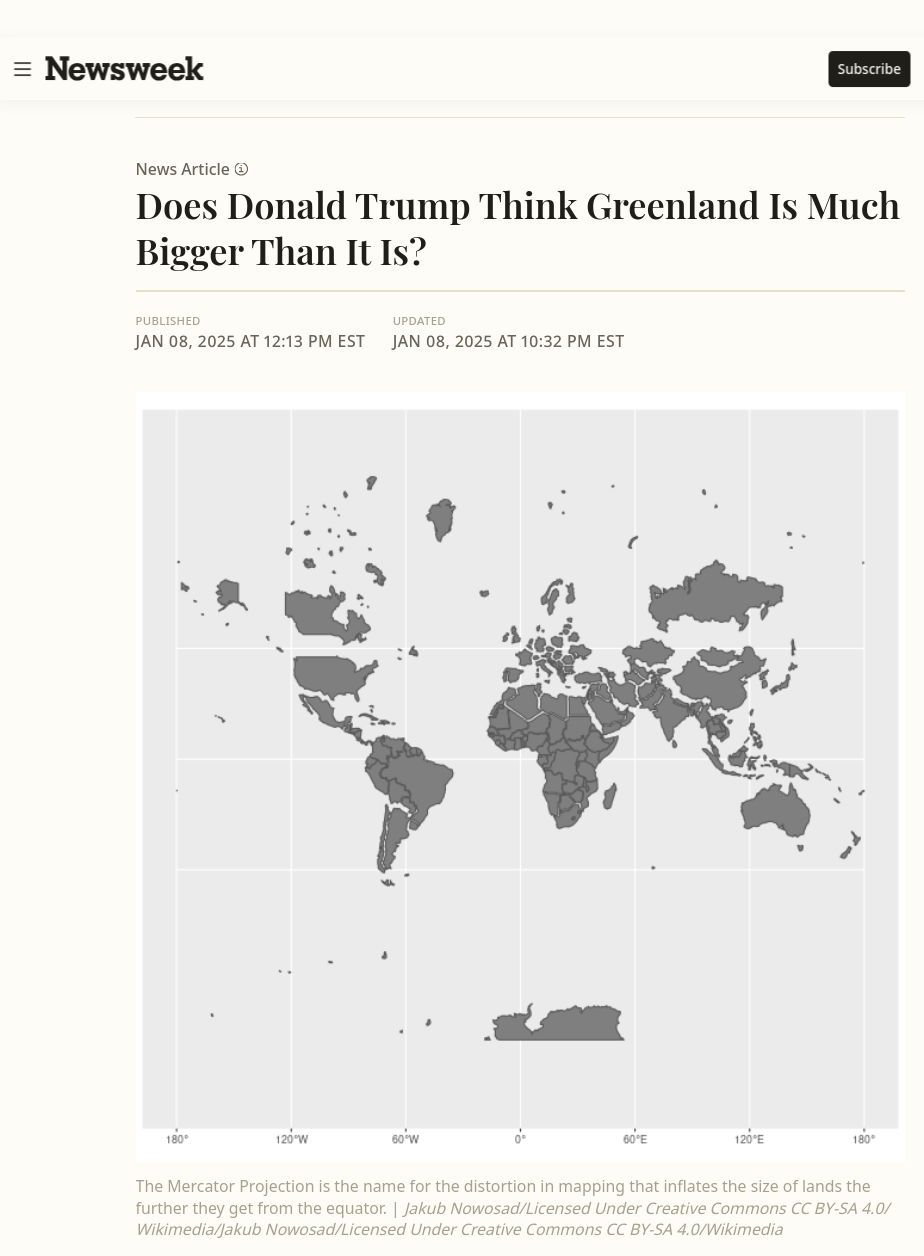
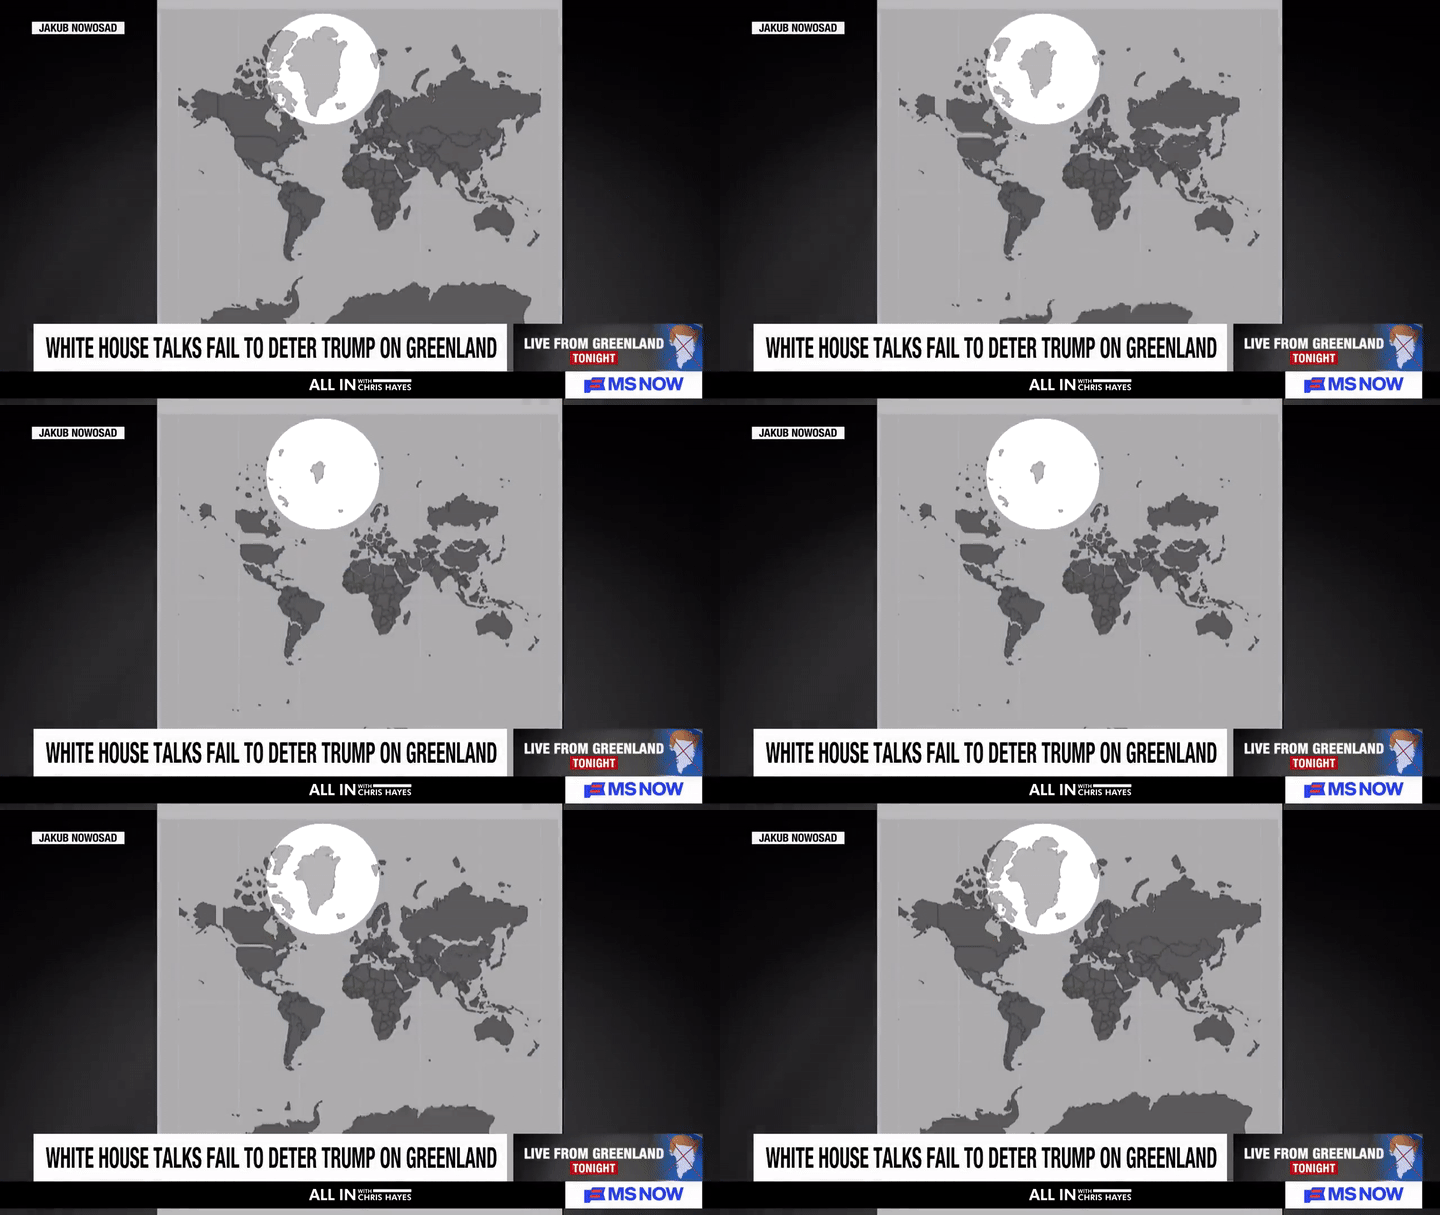
Even a silly-looking map gif can have some impact on the public discourse.
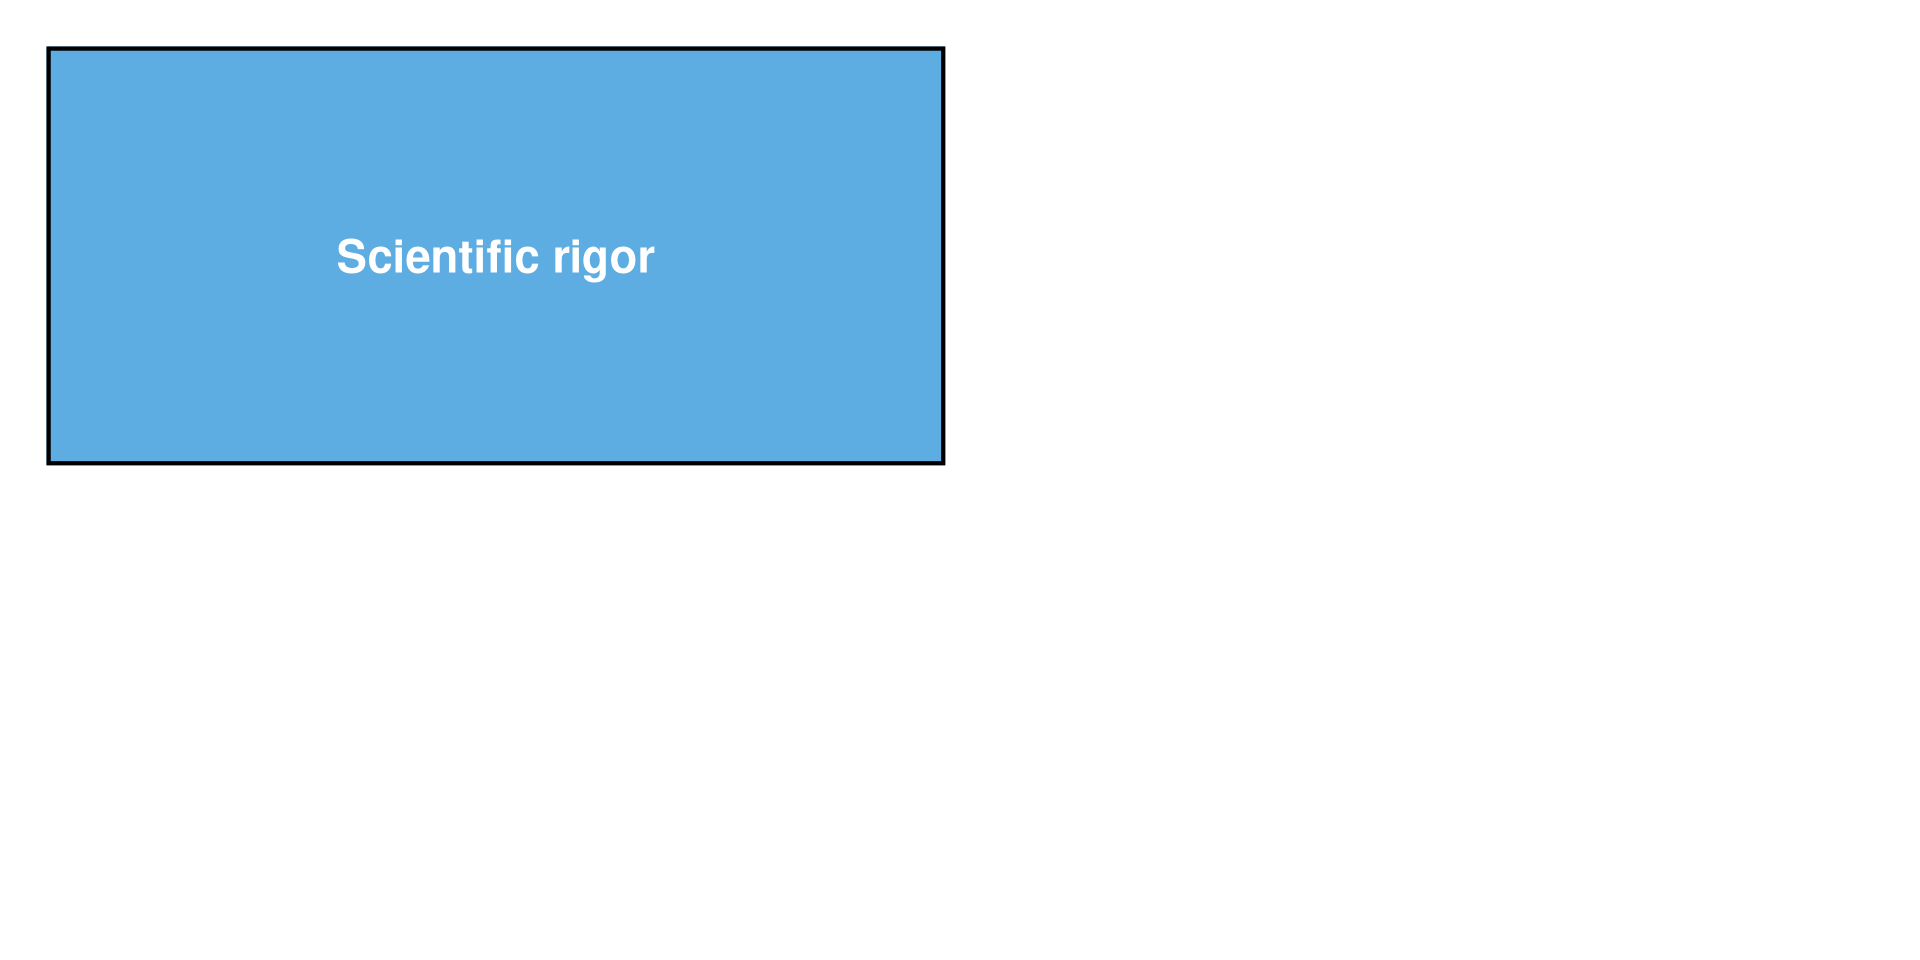
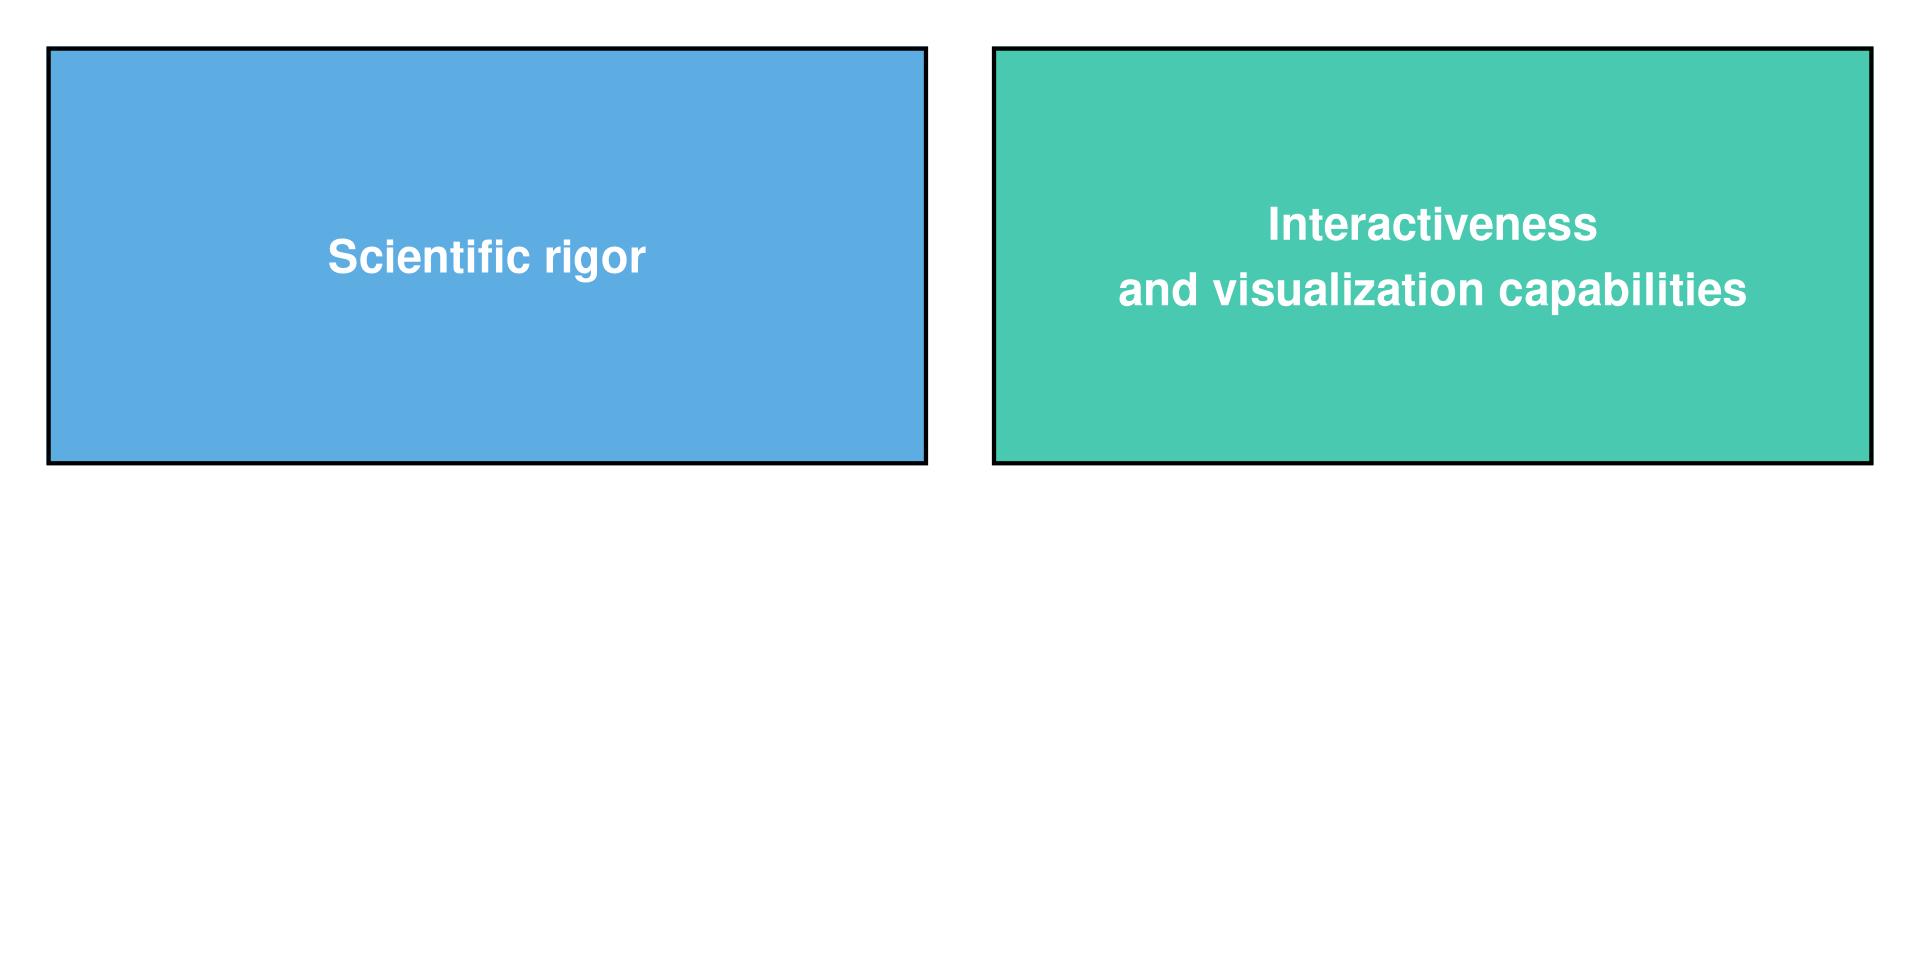
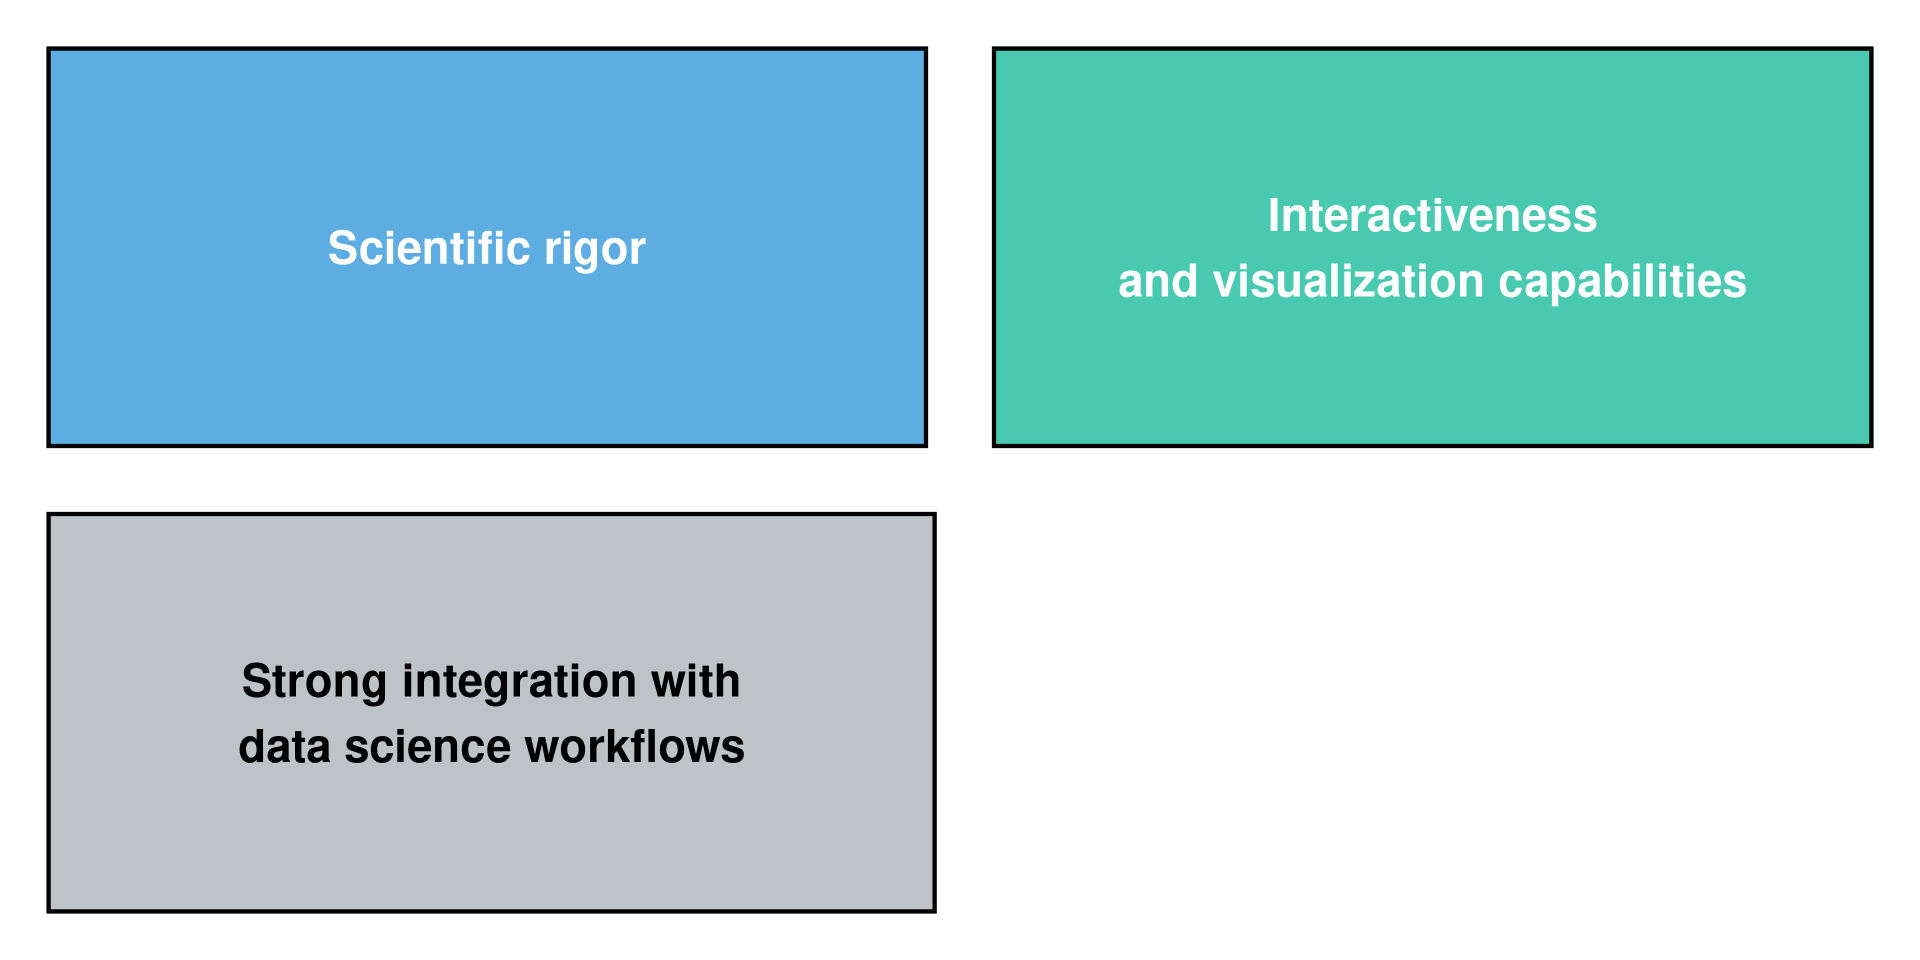
R is already strong in:
- scientific rigor and geospatial infrastructure
- visualization
- reproducible workflows
- documentation practices
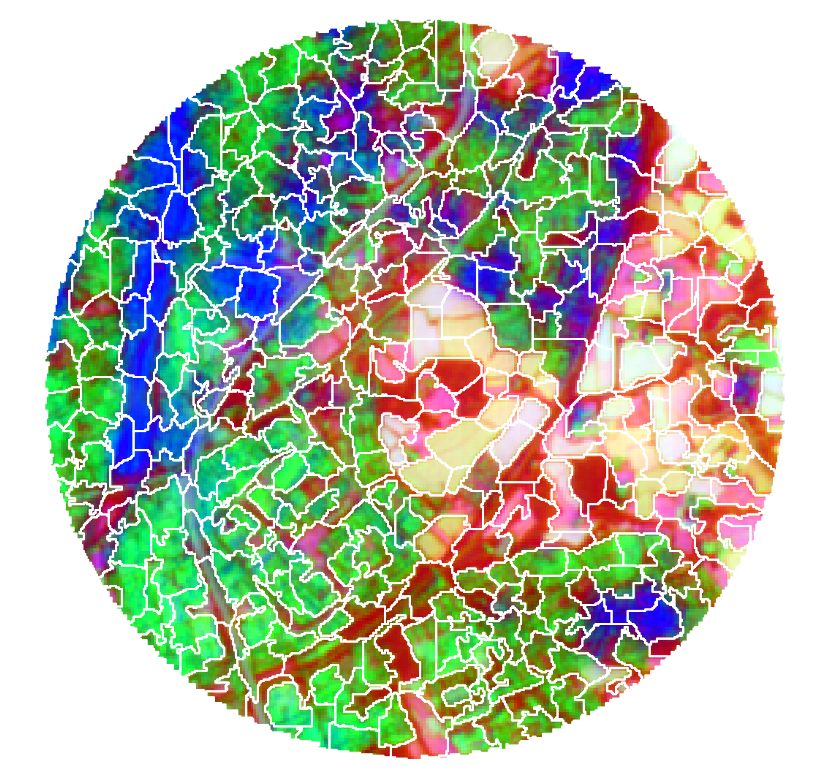
But geocomputation is moving quickly:
- deep learning for remote sensing
- discrete global grid systems
- foundation models and embeddings
- GPU-heavy workflows
Better tools are also not enough
A very accurate model can still fail in the places we care about.
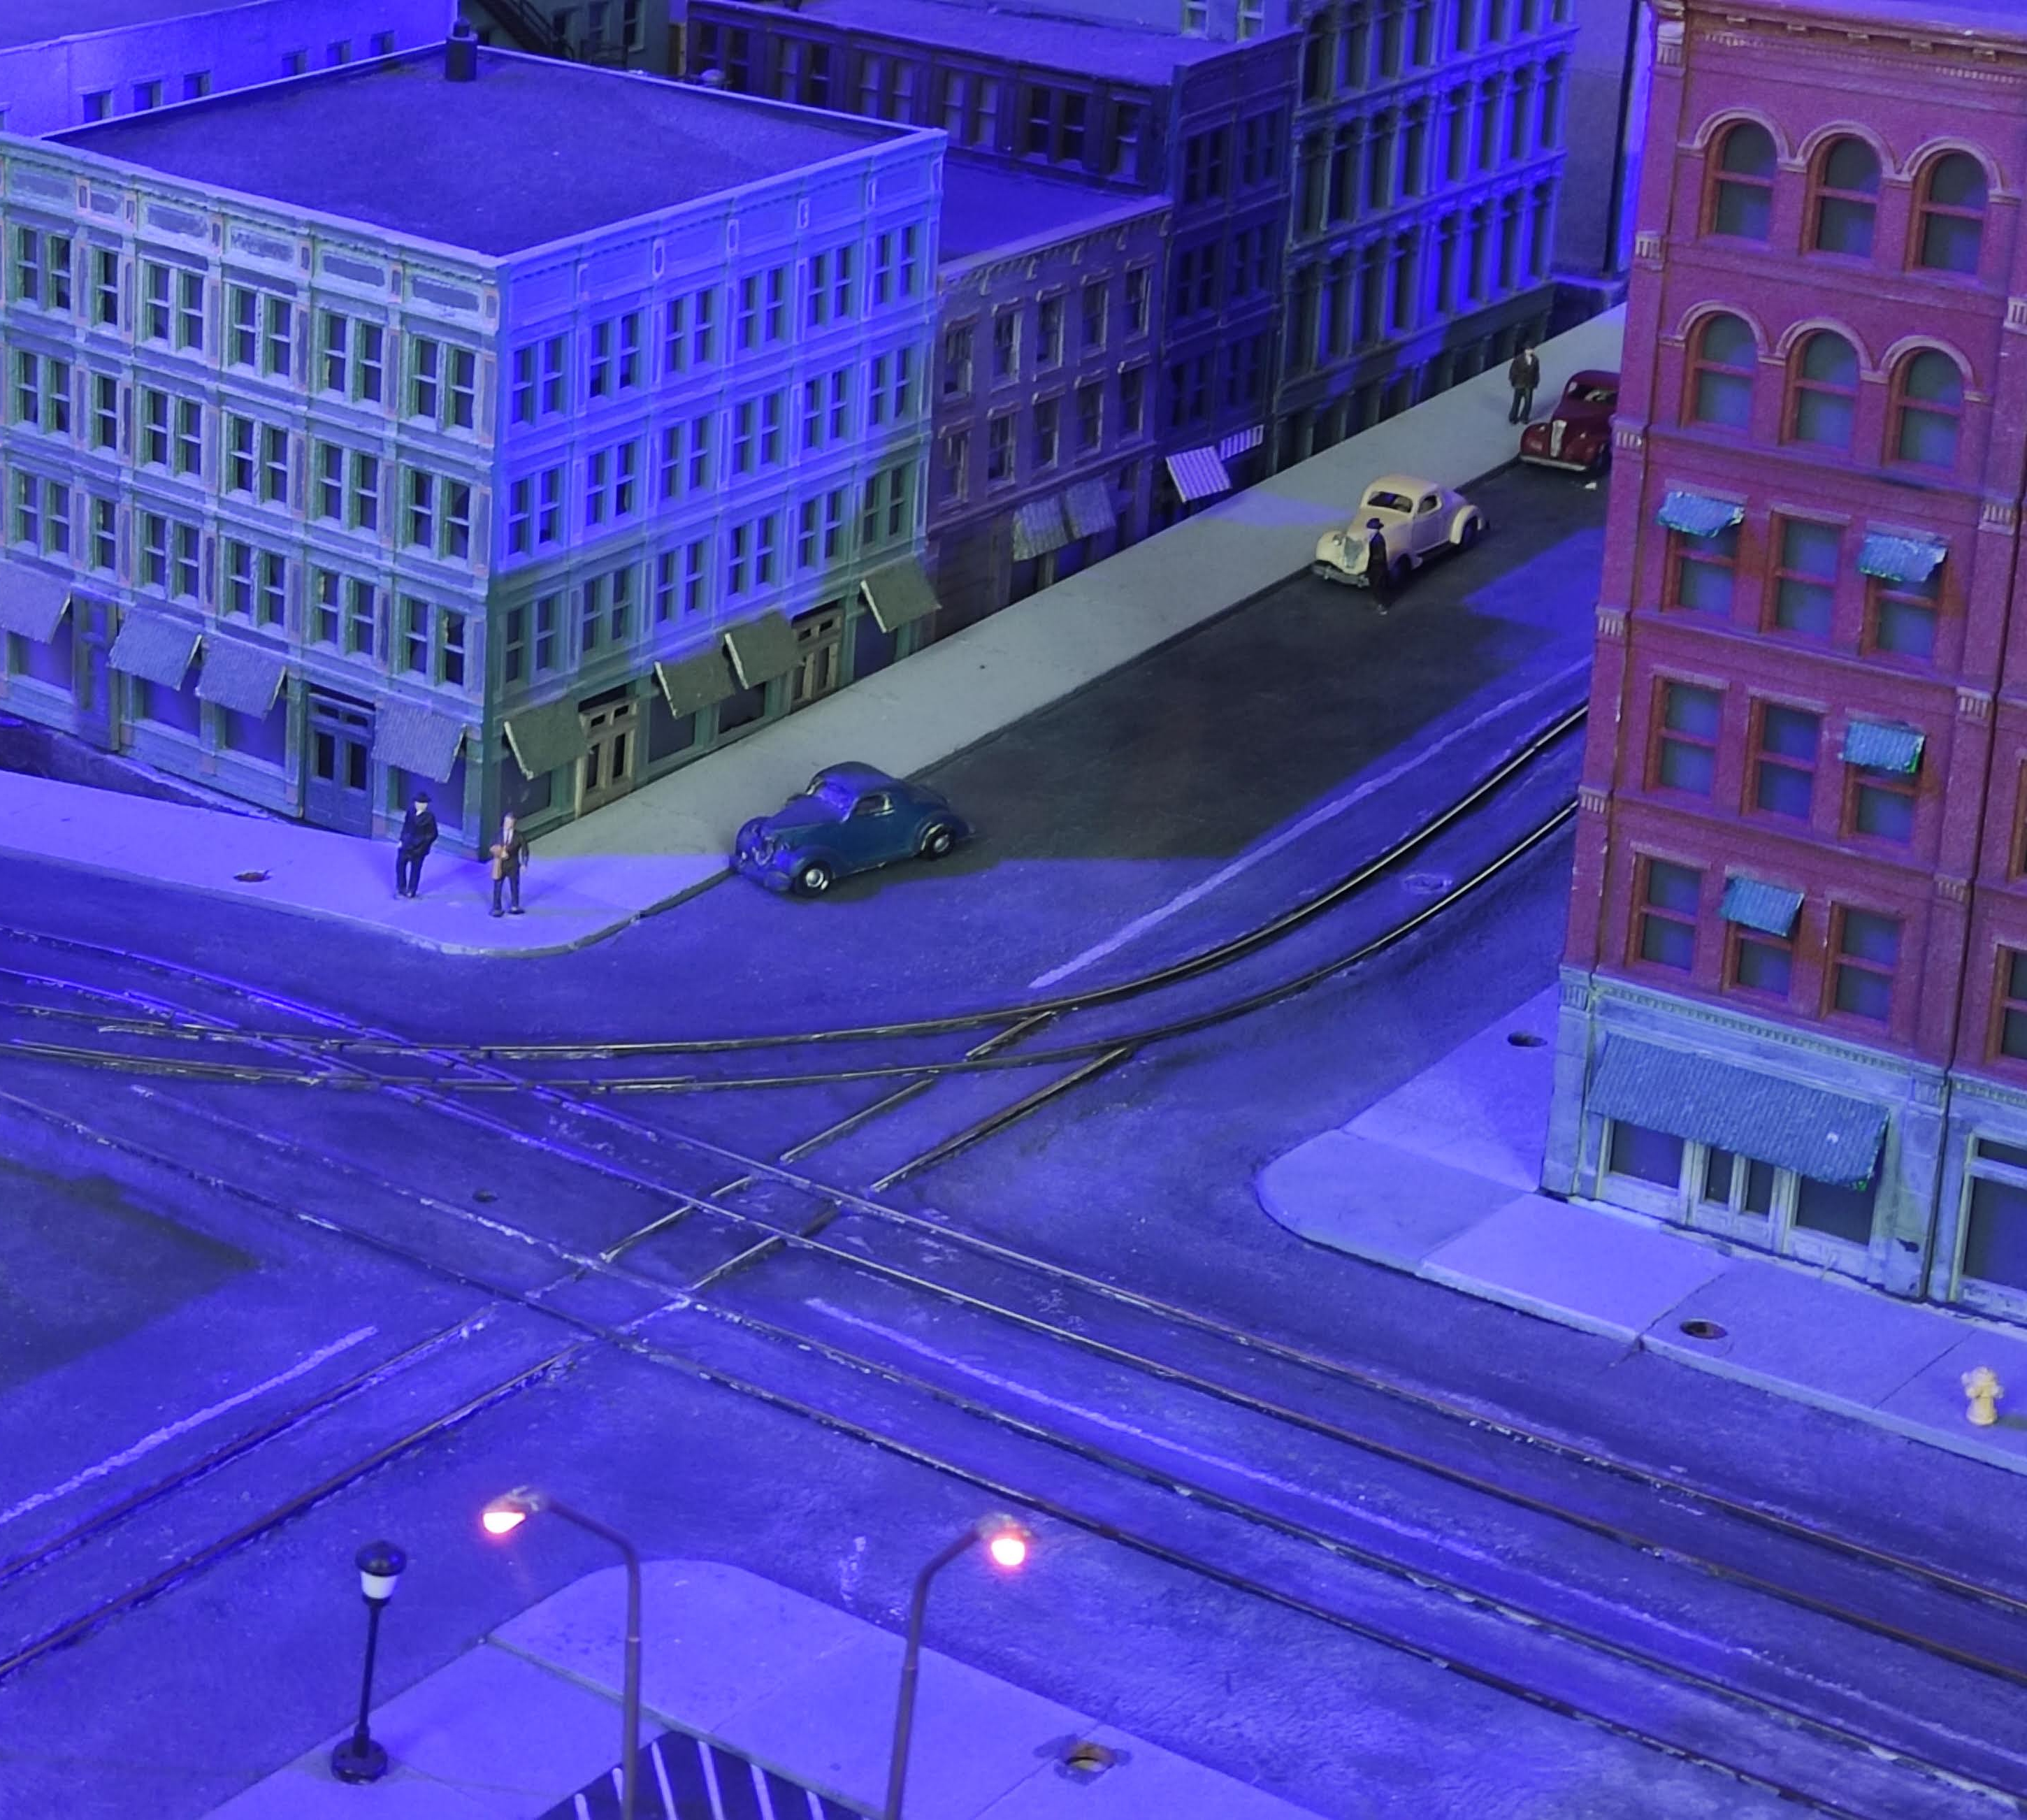
And a beautiful map can still mislead.
Even the newest methods still depend on:
- field and reference data
- domain knowledge
- careful evaluation
- honest communication
Communities are the main infrastructure
We need more than geospatial R packages:
- more usage examples
- more developers, maintainers and mentors
- broader participation and new perspectives
- be open, positive, and curious
Long-term sustainability depends on the ability to:
- absorb new ideas
- critique them seriously
- translate them into practice
- keep them alive over time
- spark interactions between people, not just between packages (and GenAI is not helping here)

So, what should we do?
Keep what already works
- stay serious about validation
- use R tools to make maps readable and honest
- continue building reproducible workflows
- remain problem-focused, not tool-focused (spatial methods are integrators across fields)
Build where the gaps are
- turn experiments into reusable examples
- share what works (and what does not) openly
- implement new methods and tooling
- collaborate across fields and languages (e.g., SDSL)
Takeaways
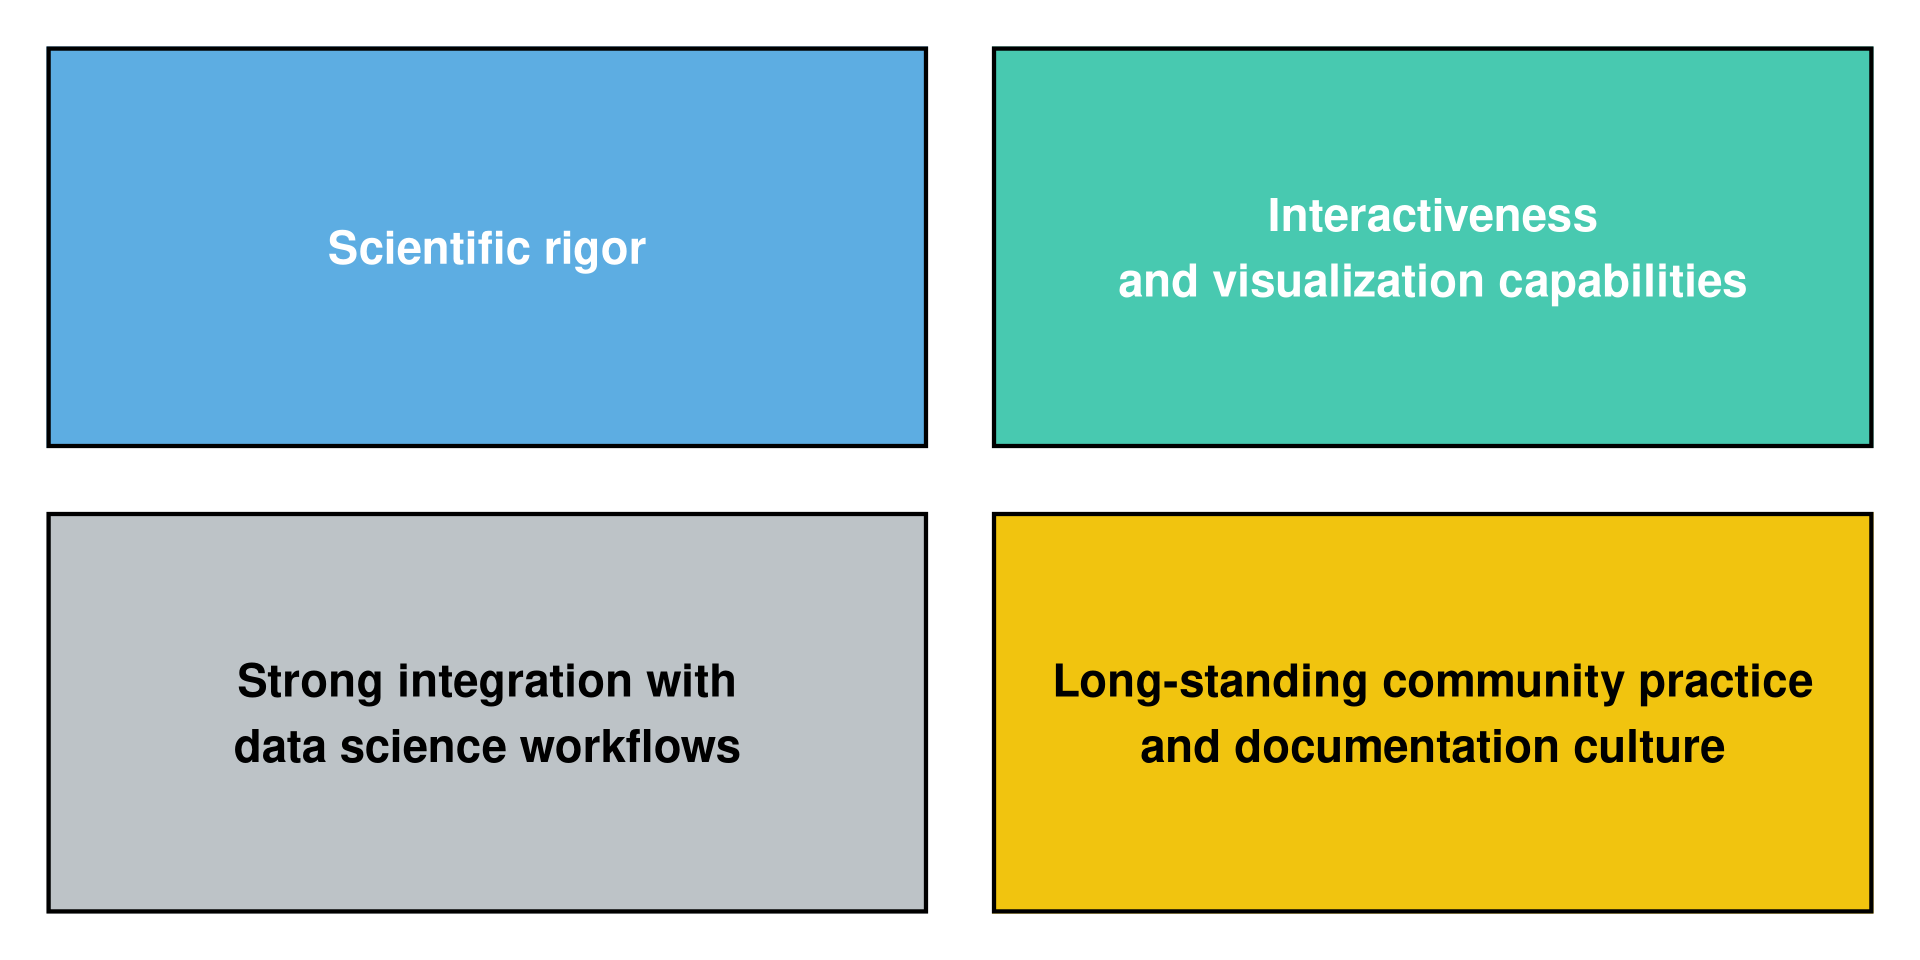
- Geocomputation with R is already strong in scientific rigor, infrastructure, visualization, and reproducible workflows.
- Tools alone are not enough: good spatial work still depends on data, domain knowledge, careful evaluation, and honest communication.
- We need more than better methods – we need stronger (geospatial) communities.
Slides: 
contact: https://jakubnowosad.com geocompx: https://geocompx.org/
Acknowledgements
Many thanks to the #RSpatial community!