The goal of patternogram is to quantify the spatial autocorrelation of values from a set of points or a raster object. It does this by calculating the dissimilarity between pairs of points at different distances, and then grouping these dissimilarity estimates into distance intervals to create a patternogram. The patternogram can be used to identify the spatial scale at which the pattern of the points or raster changes and to compare the patterns of different sets of points or rasters.
Installation
You can install the development version of patternogram from GitHub with:
# install.packages("devtools")
devtools::install_github("Nowosad/patternogram")
Example
library(patternogram)
library(terra)
#> terra 1.8.60
r = rast(system.file("ex/elev.tif", package = "terra"))
plot(r)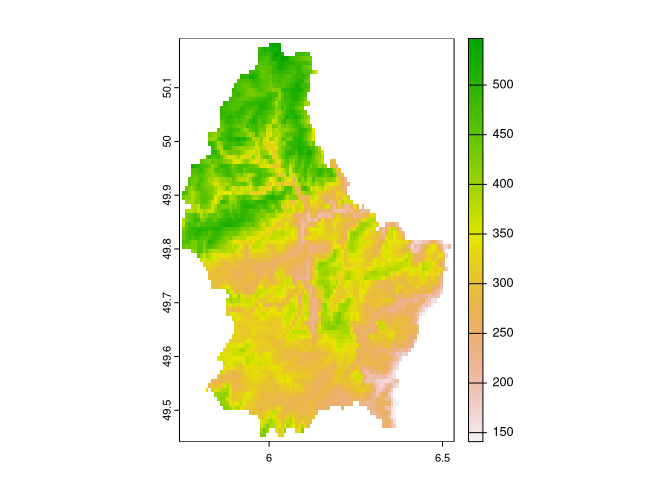
pr = patternogram(r)
pr
#> # A tibble: 15 × 3
#>       np  dist dissimilarity
#>  * <int> <dbl>         <dbl>
#>  1  2920  2300          42.3
#>  2  7904  6895          55.5
#>  3 11508 11495          62.9
#>  4 13683 16100          69.2
#>  5 14655 20700          72.5
#>  6 14795 25300          79.2
#>  7 13410 29900          85.1
#>  8 11937 34500          94.8
#>  9  9645 39100         108.
#> 10  7408 43700         129.
#> 11  5653 48300         146.
#> 12  4220 52900         164.
#> 13  2968 57450         176.
#> 14  2038 62000         186.
#> 15  1196 66600         197.
plot(pr)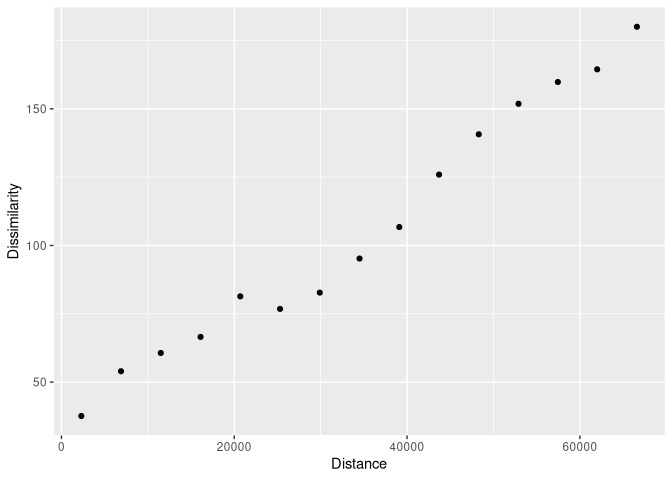
Documentation
Take a look at a conference presentation:
- Exploring spatial autocorrelation and variable importance in machine learning models using patternograms, 2023-09-06, European Conference of Ecological Modelling 2023, Leipzig - slides
Contibution
Contributions to this package are welcome - let us know if you have any suggestions or spotted a bug. The preferred method of contribution is through a GitHub pull request. Feel also free to contact us by creating an issue.