Adds spatial data of each region in an lsp or sf object
Source:R/lsp_add_examples.R
lsp_add_examples.RdAdds spatial data of each region in an lsp or sf object.
The output is an lsp or sf object with an additional column "region".
See examples.
lsp_add_examples(x, y, window = NULL)

# S3 method for class 'lsp'
lsp_add_examples(x, y, window = NULL)

# S3 method for class 'sf'
lsp_add_examples(x, y, window = NULL)
Arguments
- x
Object of class
lsp- usually a subset of the output oflsp_signature()or an object of classsf- usually a subset of the output oflsp_search()- y
Object of class
stars,stars_proxy, or terra'sSpatRaster.- window
Specifies areas for analysis. It can be either:
NULLor ansfobject. Thesfobject is only needed for adding examples of irregular regions.
Value
The input object with a new column "region".
The "region" column is a list with a raster extracted for each row.
Examples
library(stars)

landcover = read_stars(system.file("raster/landcover2015s.tif", package = "motif"))

landcover_coma = lsp_signature(landcover, type = "coma", threshold = 0.9, window = 100)
selected_coma = subset(landcover_coma, id %in% c(5, 10, 15, 35))
selected_coma
#> # A tibble: 4 × 3
#>      id na_prop signature
#>   <int>   <dbl> <list>
#> 1     5    0    <int [7 × 7]>
#> 2    10    0    <int [7 × 7]>
#> 3    15    0    <int [7 × 7]>
#> 4    35    0.32 <int [7 × 7]>

selected_coma = lsp_add_examples(x = selected_coma, y = landcover)
selected_coma
#> # A tibble: 4 × 4
#>      id na_prop signature     region
#>   <int>   <dbl> <list>        <list>
#> 1     5    0    <int [7 × 7]> <stars[,100]>
#> 2    10    0    <int [7 × 7]> <stars[,100]>
#> 3    15    0    <int [7 × 7]> <stars[,100]>
#> 4    35    0.32 <int [7 × 7]> <stars[,100]>

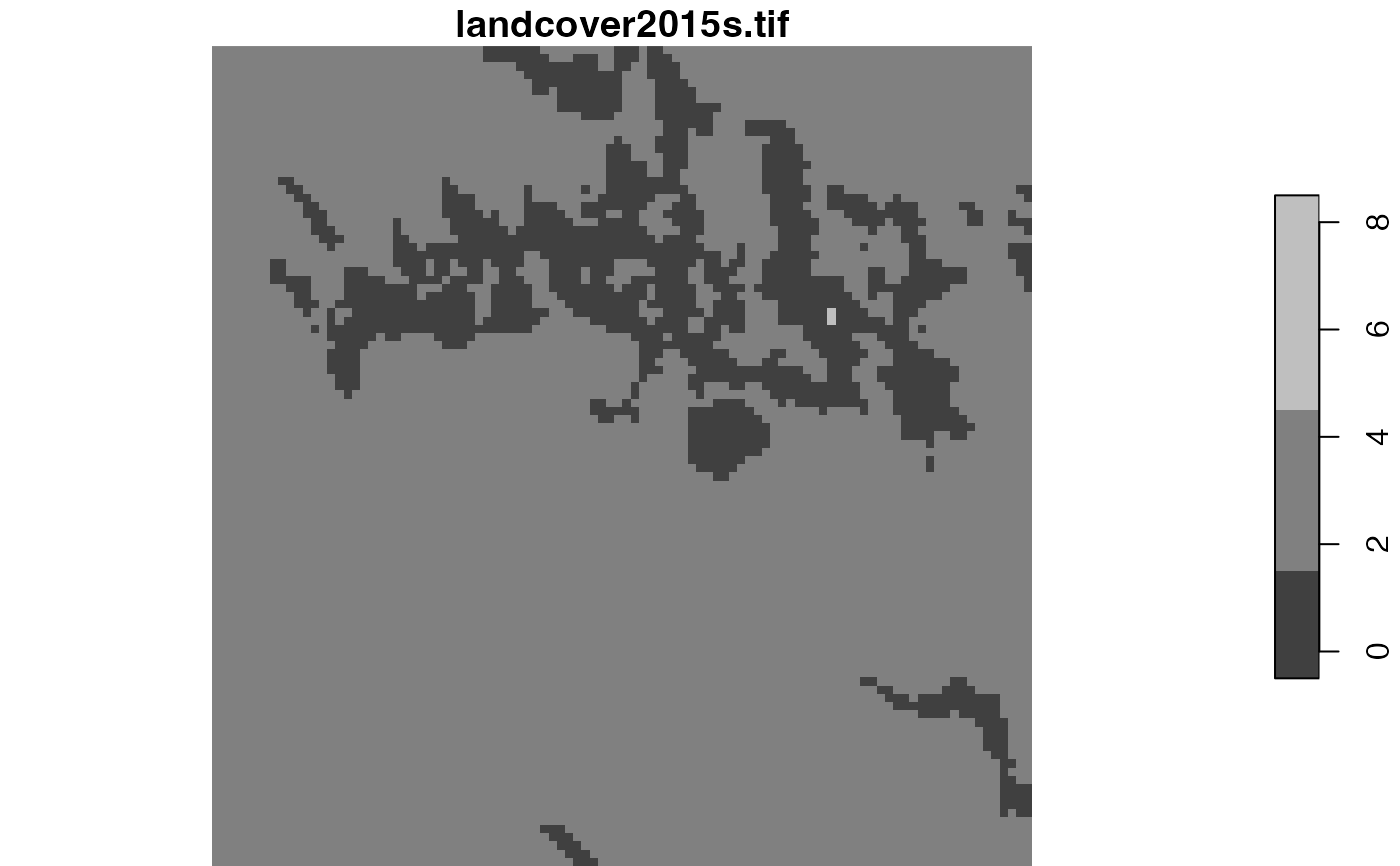
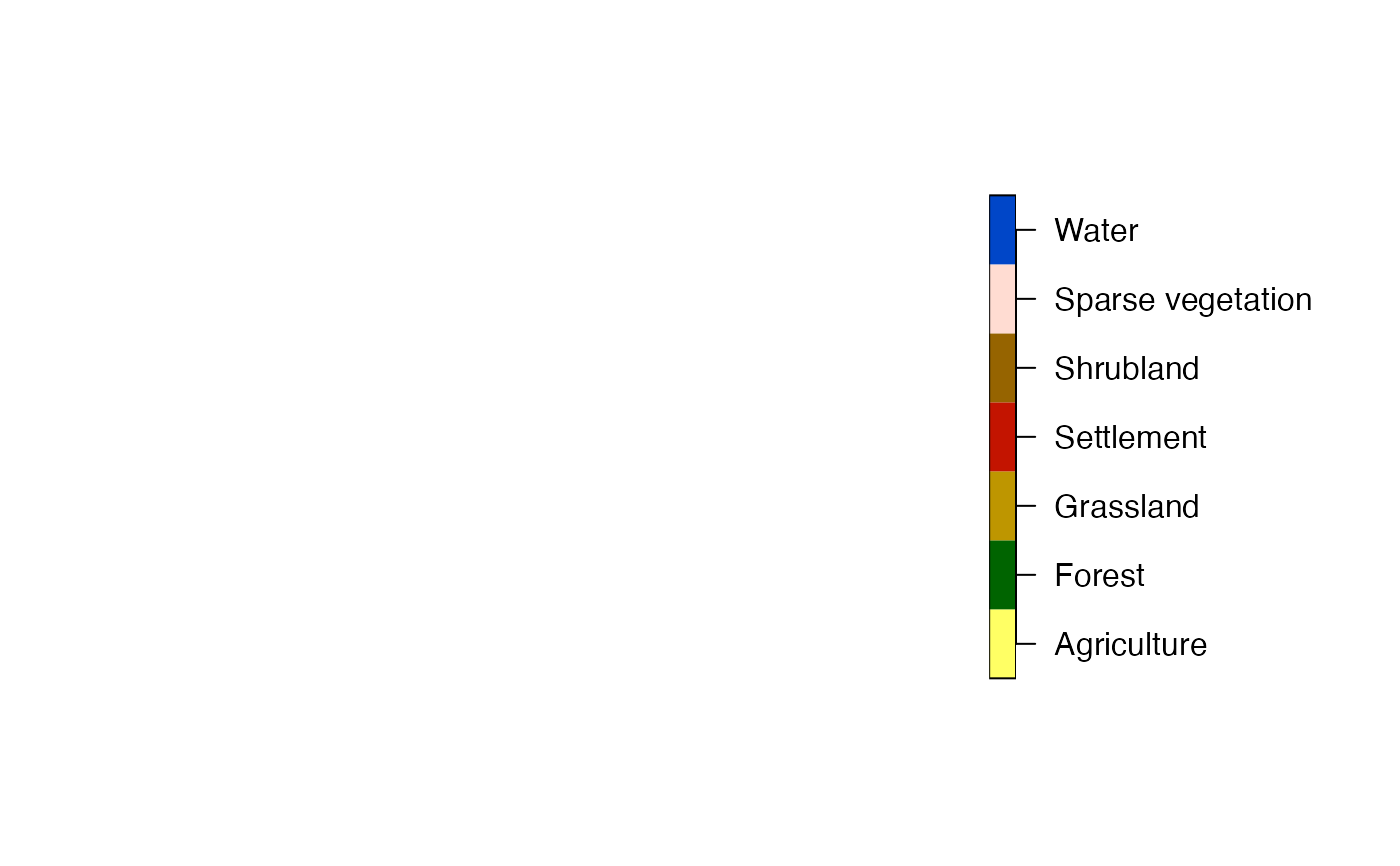
plot(selected_coma$region[[1]])

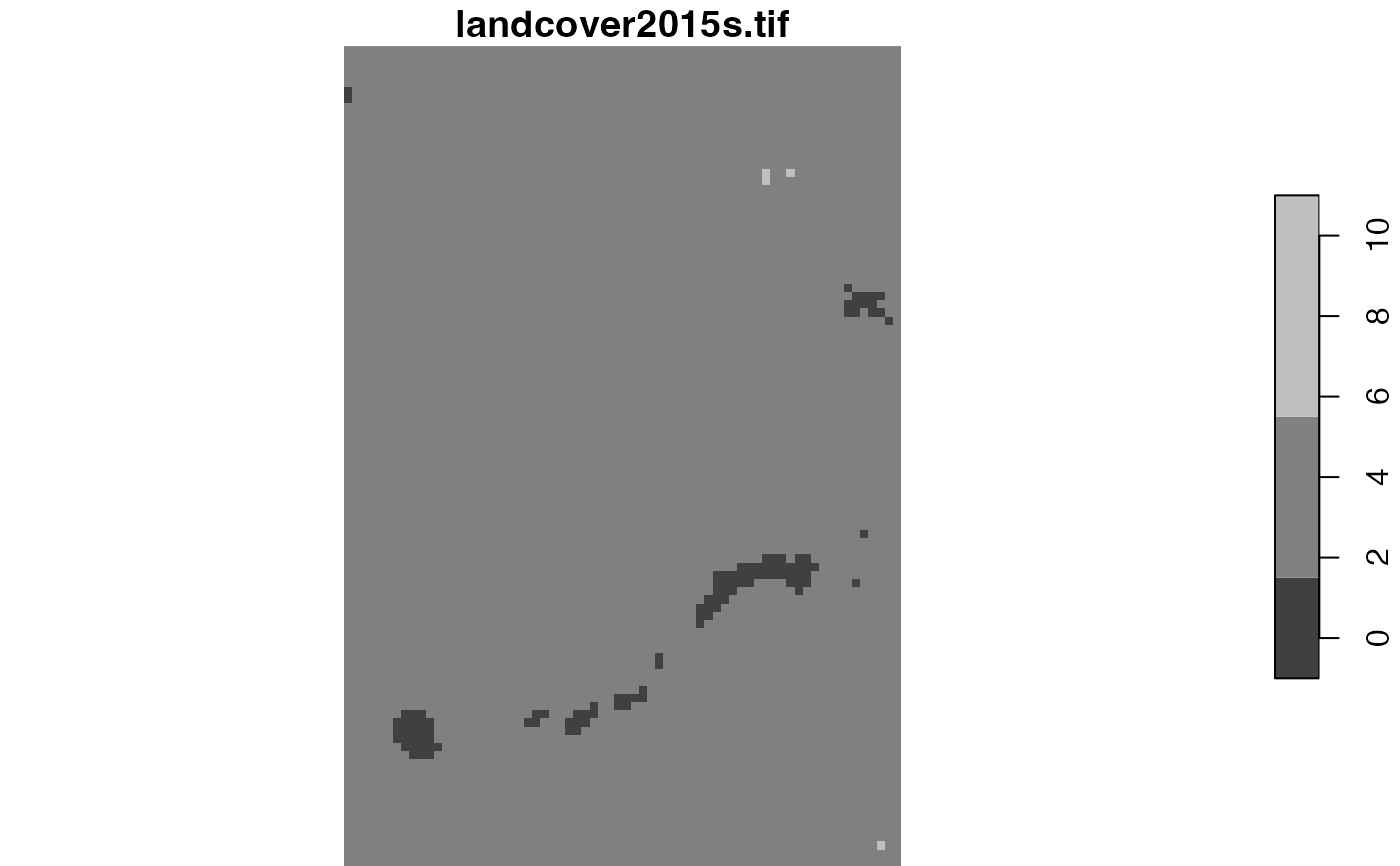
plot(selected_coma$region[[4]])


# \donttest{
# larger data example
library(stars)

landcover = read_stars(system.file("raster/landcover2015.tif", package = "motif"))

landcover_coma = lsp_signature(landcover, type = "coma", threshold = 0.9, window = 100)
selected_coma = subset(landcover_coma, id %in% c(5, 80, 1971, 2048))
selected_coma
#> # A tibble: 4 × 3
#>      id na_prop signature
#>   <int>   <dbl> <list>
#> 1     5  0.357  <int [7 × 7]>
#> 2    80  0      <int [7 × 7]>
#> 3  1971  0.0086 <int [7 × 7]>
#> 4  2048  0.790  <int [7 × 7]>

selected_coma = lsp_add_examples(x = selected_coma, y = landcover)
selected_coma
#> # A tibble: 4 × 4
#>      id na_prop signature     region
#>   <int>   <dbl> <list>        <list>
#> 1     5  0.357  <int [7 × 7]> <stars[,100]>
#> 2    80  0      <int [7 × 7]> <stars[,100]>
#> 3  1971  0.0086 <int [7 × 7]> <stars[,100]>
#> 4  2048  0.790  <int [7 × 7]> <stars[,100]>

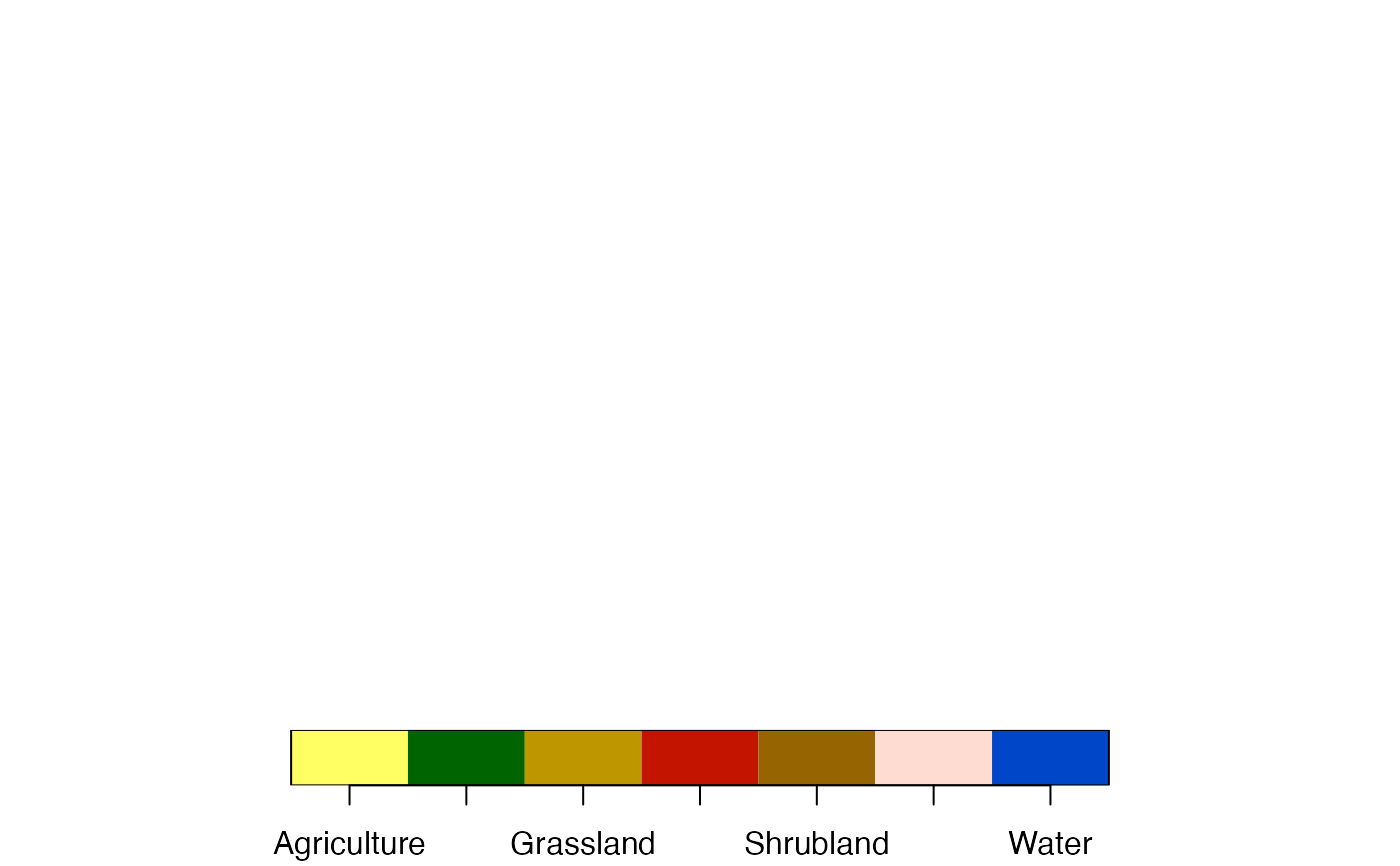
plot(selected_coma$region[[1]])

plot(selected_coma$region[[4]])

# }
# }